


A. N. Severtsov Institute of Ecology and Evolution, Russian Academy of Sciences, 33 Leninsky prospect, Moscow 119071, Russia
RATIONALE: Stable isotope analysis (SIA) is used widely for reconstructing trophic links of vertebrate and invertebrate animals. Soil macrofauna form a substantial food source for a range of predators including amphibians, reptiles, birds and mammals. SIA-based estimations of their trophic niches require knowledge on the full range of isotopic signatures of potential preys. Considering the extremely high diversity of soil animals, this information is not easy to obtain.
METHODS: We estimated a typical range of the isotopic signatures of soil macrofauna by compiling published and original data on soil macroinvertebrates in 11 temperate forests. We examined whether the baseline correction (i.e. subtracting δ13C or δ15N values of local litter) would decrease the between-site variability in the δ13C and δ15N values of soil animals. The dataset was subsequently used to estimate the frequency distribution of δ13C and δ15N values in saprophagous and predatory soil animals.
RESULTS: The baseline correction reduced the between-site variability in δ15N, but not in δ13C values of soil animals.
Over 95% of the taxa or individuals examined fell into an isotopic space with uncorrected δ13С values ranging from 27.9 to 22.5‰, and litter-normalized δ15N values from 0.8 to 9.6‰. Saprophagous and predatory soil animals were on average enriched in 13C relative to plant litter by 3.5 and 2.7‰, respectively, which is likely to reflect the importance of saprotrophic microorganisms as the main energy source in soil food webs. The difference in δ15N values between saprophages and predators averaged 2.8‰, which fits the anticipated trophic enrichment per trophic level.
CONCLUSIONS: Our results indicate that the range of possible δ15N values of soil macrofauna in temperate forest ecosystems can roughly be predicted based on the δ15N values of plant litter. On the other hand, no site-specific normalization is usually required when predicting the range of δ13C values of soil macroinvertebrates. Copyright ©
2014 John Wiley & Sons, Ltd.
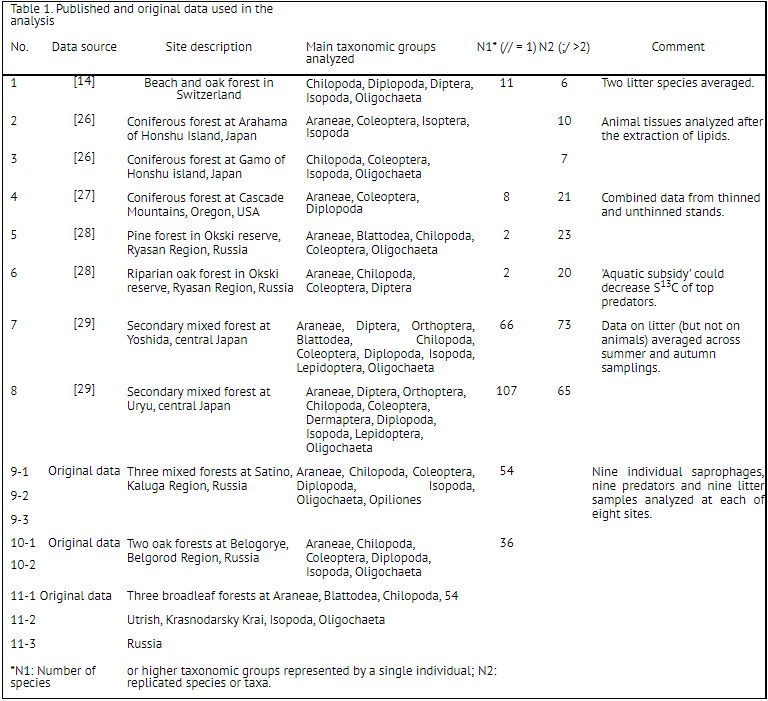
Stable isotope techniques have become one of the main methodological advances in trophic ecology, both above and below ground.[1–4] The stable isotope composition of animals provides information on their trophic position and main trophic links.[5,6] The carbon isotope ratio of body tissues (13C/12C, usually expressed as a standardized ratio δ13C) is approximately stable across trophic levels, but depends on resource type. The nitrogen isotope ratio (15N/14N, usually expressed as δ15N) increases by about 2–4‰per trophic level, thus indicating the relative position of an individual within a food web. Different versions of mathematical mixing models are used to estimate the contributions of food sources to the isotopic composition of the tissues of a consumer, which reflects the assimilated diet.[7,8] The application of mixing models requires a correct estimation of the full range of isotopic values of all major food sources used by an animal.[9] Although belowground detrital food webs are spatially separated from aboveground ones, they are connected by numerous links.[10,11] In particular, soil macroinvertebrates are important food sources for aboveground predators, from spiders and amphibians to birds and mammals. In fact, the reat majority of top-level predators, both in terrestrial and in aquatic ecosystems, obtain energy from detritus.[12] The belowground subsidy strongly affects the dynamics of aboveground food webs,[11] for example by supporting higher density levels of generalist predators.[13] ’Aboveground’ ecologists largely ignore the functional diversity of soil-dwelling animals, this being reflected in a wide range of their isotopic signatures, even within taxonomically related species like earthworms.[14,15] Sampling of soil animals is laborious and time-consuming, even dominating species being difficult to obtain for analysis. Therefore, a limited selection of ’easy-to-get’ samples of invertebrates is often used when soil animals are treated as a hypothetical food source for aboveground predators (e.g.[16–18]). Meanwhile, several detailed studies on the isotopic composition of soil animals have been performed, mainly in temperate forests (see Experimental section, Table 1). One would expect the range of δ13C and δ15N values of soil animals to be roughly similar across ecosystems of similar type (e.g. boreal or temperate forests) if normalized to the isotopic composition of the main basal sources (i.e. plant tissues and soil organic matter). Moreover, the main trophic groups of soil animals, i.e. saprophages and predators, can roughly be distinguished according to their isotopic composition.[14,19]
This would allow a more precise reconstruction of trophic links and energy fluxes between below- and aboveground systems. Since the temperate and boreal forests of the northern hemisphere are overwhelmingly dominated by plants with C3 photosynthesis type, variation in plant δ13C values across ecosystems is relatively little.[20] Variations in the δ15N values of soil and litter are much more pronounced since nitrogen is often a limiting element which is conserved and recycled mainly within a local community. The topographic position, the openness of biogeochemical N cycles, the input of atmospheric N of different (often anthropogenic) origins and of fertilizers can lead to pronounced differences in soil δ15N values amongst forest ecosystems.[21] Therefore, a ’baseline correction’ is often applied when data from different localities are compiled.[22,23] Unfortunately, an estimation of the correction factor is not an easy task and needs a careful choice of reference materials. Different litter and soil layers vary in their δ15N values while soil animals inhabiting different soil layers generally follow this pattern.[3] Soil microorganisms of different functional groups that form the main food source for soil microbivores and saprophages, e.g. mycorrhizal and saprotrophic fungi, often differ strongly in their δ15N (and also δ13C) signatures.[24] The baseline can be estimated using long-living and usually relatively large soil animals with a distinct trophic position (e.g. epigeic earthworms[25]), but this approach cannot be universally adopted due to the differences in local community composition. The need for a baseline correction, which is usually much smaller than a typical range of intra-community variation in δ15N values of soil animals, remains therefore questionable. In this study, we address three main questions: (1) what is the typical range of the isotopic signatures of soil macrofauna in temperate forests; (2) whether the ’baseline correction’ is needed for estimating the range of δ15N and δ13C values of soil invertebrates in local communities; and (3) what is the mean difference in the isotopic signatures of two main trophic groups of soil invertebrates (saprophages and predators). To answer these questions, we used both published and original data. We hypothesized that, although the isotopic composition of basal resources of soil detrital food webs (soil organicmatter, fungi and bacteria, plant roots) can differwithin and across habitats, the range of isotopic signatures of soil animals would vary in a predictable way and can be approximated using data on the isotopic composition of dominant litter species. The estimated range of δ13C and δ15N values can be used subsequently as a proxy in isotope-based reconstructions of below- and aboveground food webs.
EXPERIMENTAL
Published data
For the survey of published data, we selected studies that had been performed in temperate forests and included an analysis of isotope composition of carbon and nitrogen in soil macroinvertebrates belonging to different taxonomic and functional groups. We did not consider studies dealing with δ15N or δ13C values only, nor did we use those devoted to particular groups of soil animals (e.g. earthworms). For our analysis we selected five papers, which described isotopic compositions of soil fauna in eight forest ecosystems, mainly in Japan and Russia (Table 1). A seminal work by Ponsard and Arditi[19] was not included in the dataset because the δ13C and δ15N values of animals were reported separately. From each paper, the δ13C and δ15N values of soil- and litterdwelling macroinvertebrates were extracted from the text and figures. We used the taxonomic resolution levels provided in the original publications (from species to families). Hymenopterans (ants) were not included in the analysis because they are often linked trophically to aboveground grazing food chains. We also omitted decapods,[26] as the isotopic composition of these animals exotic for temperate forest could be strongly affected by the presence of inorganic C in the carapax. Nevertheless, the inclusion of these groups would not have any significant effect on the numerical results of this study (data not shown). Of the 421 pairs of δ values used in the analysis, 224 (53.4%) were mean values of δ13C and δ15N of particular species or higher taxonomic groups with the number of replications ≥2, whereas 196 (46.6%) were individual measurements (n = 1) (Table 1). Thus, in the figures herein each point represents either a single individual or a mean value of a species or a higher taxonomic group. Themain part (n=276) of the published data that included taxa with relatively well-known trophic specializations was divided into predators (centipedes, spiders, carabid beetles etc.) and saprophages sensu lato (millipedes, earthworms, woodlice, etc.). Among carabids, only those with an unequivocal trophic position were selected; mixophagous species (mainly Harpalinae) were excluded. Many other taxa (e.g. Coleopteran larvae[29]) could not be attributed a priori to a certain trophic group, therefore were also excluded from the corresponding part of analysis.
Original data
The study was carried out in May–July 2008 at three forest sites in European Russia: ’Satino’ at the Borovsk Research Station of the Moscow State University (Kaluga Region, 55°12’28’’N, 36°22’58’’E), ’Belgorod’ at Belogorye State Nature Reserve (Belgorod Region, 50°37’04’’N, 35°57’47’’E), and ’Utrish’ at the Utrish State Nature Reserve (Krasnodar Krai, 44°42’20’’N, 37°28’15’’E). At each site, samples were collected on either three (Satino, Utrish) or two (Belgorod) plots. The distance between the plots ranged from2 to 4 km. On each plot, nine individuals of saprophagous (Lumbricidae, Isopoda, Diplopoda, Blattodea) and nine individuals of predatory (Araneae, Opiliones, Lithobiidae, Geophilidae, Carabidae) soil animals were collected by hand-sorting of litter and the upper mineral soil, along with nine samples of litter of dominating tree spices. The taxonomic composition of the collected animals was equalized neither among different plots nor among sampling sites; rather, the most abundant species were randomly picked up. In total, 72 individual saprophagous animals, 72 predators and 72 samples of litter were collected and analyzed (a full dataset is given in Supplementary Table S1, see Supporting Information). If possible, eithermuscular tissue or legs ofmacroinvertebrates were taken for the isotopic analysis. All collected samples were oven-dried at 50°С for 4–5 days. Litter samples were ground to powder with a MM200 ball mill (Retsch GmbH, Haan, Germany). Plant and animal tissues were wrapped in tin foil (1200–1500 μg and 400–600 μg, respectively) and their isotopic composition determined using a Thermo Scientific Delta V Plus continuous-flow mass spectrometer (Thermo Electron GmbH, Bremen, Germany), coupled with a Flash 1112 elemental analyzer (Thermo Electron) at the Institute of Ecology and Evolution of the Russian Academy of Sciences (Moscow, Russia). The isotopic composition of N and C was expressed in the δ-notation relative to the international standard (atmospheric nitrogen or VPDB): δX(‰) = [(Rsample/Rstandard)1]× 1000, where R is the ratio of the heavier isotope to the lighter isotope.
Samples were analyzed with a reference gas calibrated against IAEA (Vienna, Austria) referencematerials USGS 40 and USGS 41 (glutamic acid). The drift was corrected using an internal laboratory standard (acetanilide). The standard deviations of the δ13C and δ15N values in USGS 40 (n = 8) were <0.15‰.
Data analysis
The analysis included three main steps. First, we checked whether data on the isotopic composition of local plant litter are needed to correctly estimate the range of δ13C and δ15N values of soil invertebrates. To this end, we compared the difference in the isotopic composition of C and N in invertebrates (separately for saprophages and predators) among published studies using the nonparametric Kruskal-Wallis test. This analysis was performed twice, using either original (’raw’) or ’litter-normalized’ δ13C and δ15N values. For the normalization, themean δ13C and δ15N values of litter reported in each study were used according to the equations:
LC-δ13C ¼ δ13Canimal – δ13Clitter (1)
LC-δ15N ¼ δ15Nanimal – δ15Nlitter (2)
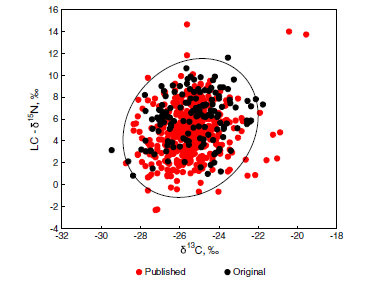
where LC stands for ’litter corrected’. The results of this analysis were subsequently verified by comparing the whole datasets of published and original data in the ’raw’ and ’litter- ormalized’ isotopic δ-space. Published data (n = 421) were put into an isotopic bi-plot, and an ellipse containing 95% of all samples was drawn using a corresponding function in Statistica 7.0. Original data (n = 144) were added into each plot and the proportion of cases within and outside the ellipse was calculated. The original and published data were then combined to obtain information on a typical range of δ13C and δ15N values of soil animals in temperate forests. Pearson correlation was used to assess the dependence of the mean δ13C and δ15N values of soil animals on the isotopic composition of litter. In addition, we compared the variance (s2) of either the raw or litter-normalized mean δ13C and δ15N values among sites. The combined dataset was subsequently used to compare the frequency distribution of the δ13C and δ15N values of saprophagous and predatory soil invertebrates. Multivariate analysis of variance (MANOVA) was used to estimate the reliability of differences in the isotopic signature of animals belonging to these trophic groups. Finally, we estimated the differences in δ13C and δ15N values between neighboring trophic levels. Due to the low number of replications in many studies, median rather than mean litter-normalized δ15N and δ13C values of saprophages and predators were compared for each of 15 studies (Δ, median δpredators – median δsaprophages). Calculations were performed in Statistica 7.0 (Statsoft, Tulsa, USA). Data are presented as means ± 1 SE.
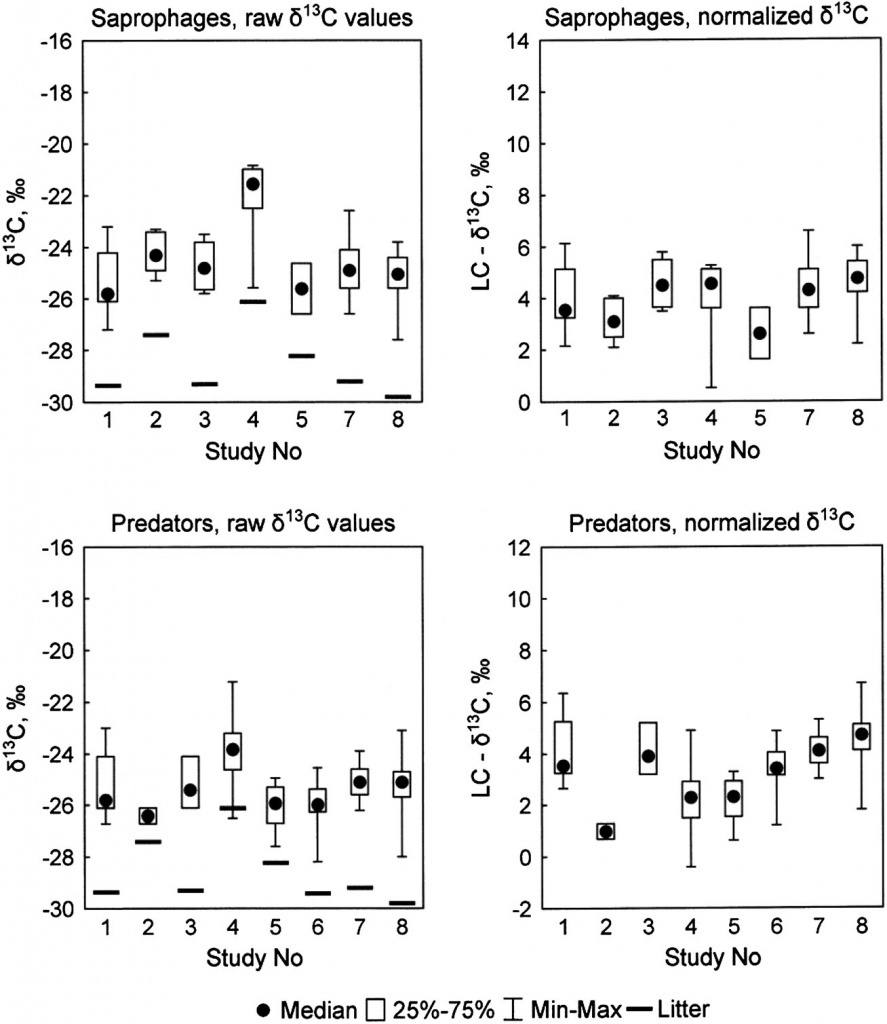
Figure 1. Distribution of δ13C values in plant litter, saprophagous and predatory soil animals in published studies. Mean δ13C values are shown for litter; median, quartiles, minimum and maximum values for animals. Litter-normalized (LC, right graphs) δ13C values were obtained by subtracting δ13Clitter from δ13Canimal. Saprophages were not reported in study #6.
RESULTS
Among published studies, the mean δ13C values in plant litter ranged from 29.8 ± 0.3‰ (Uryu, Japan, #8 in Table 1) to 26.1 ± 0.4‰ in Cascade Mountains, USA (#4). The mean δ15N values varied from 5.6 ± 0.2 to 0.9 ± 0.2‰. The isotope composition of plant litter in the original dataset generally lay within the range of published values, although the δ15N values reached 0.9 ± 0.6‰ at one of the study sites (#9-1, Supplementary Table S1, Supporting Information).
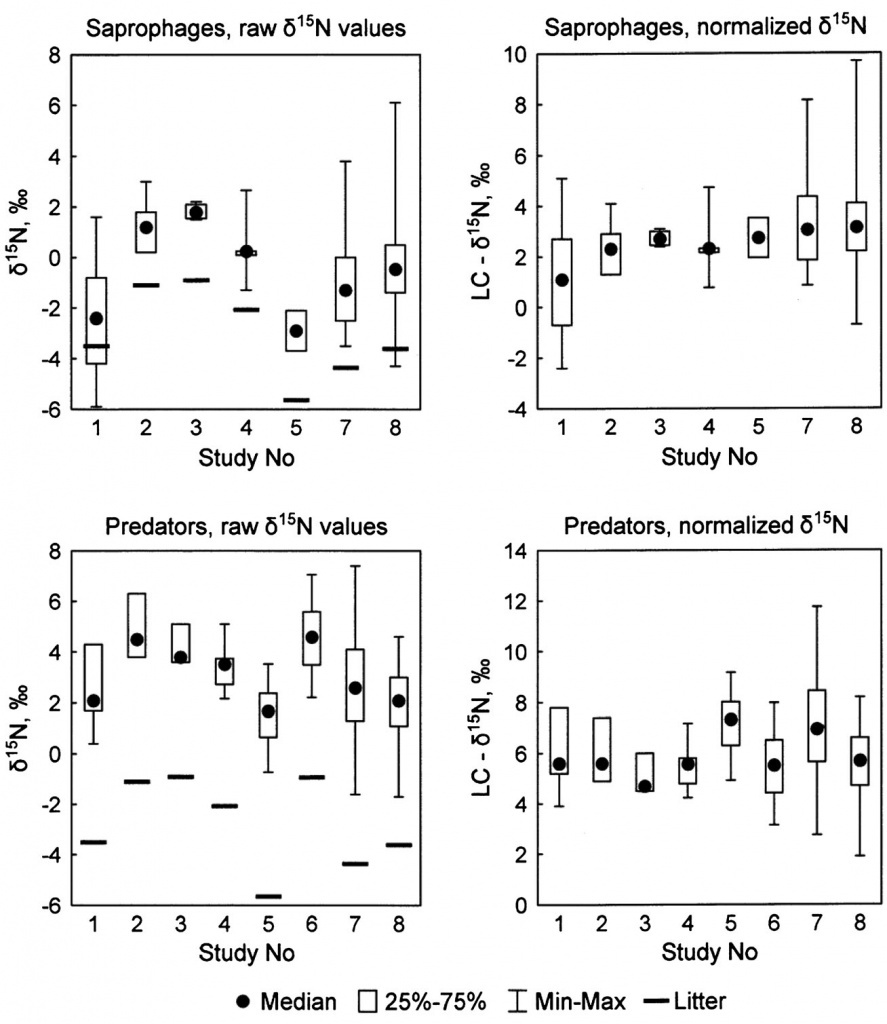
Figure 2. Distribution of δ15N values in plant litter, saprophagous and predatory soil animals in published studies. Mean values are shown for litter; median, quartiles, minimum and maximum values for animals. Litternormalized (LC, right graphs) δ15N values were obtained by subtracting δ15Nlitter from δ15Nanimal. Saprophages were not reported in study #6.
The carbon isotope composition of animals varied considerably among published studies, which could partly be ascribed to the variation in the mean δ13C values in local litter (Fig. 1). Although the mean δ13C values of litter and saprophagous invertebrates were conspicuously higher in the study #4[27] than at the other sites, the δ13C values of saprophages did not differ significantly among studies (Kruskal-Wallis test:H6, 102=11.8, p = 0.067). Surprisingly,when the litter-normalized LC-δ13C values were compared, the difference among studies increased (H6, 102=14.6, p=0.023). The raw δ13C values of predators differed significantly in different studies (Kruskal-Wallis H7, 174 = 53.5, p <0.0001), this difference only increasing if the LC-δ13C values were compared (H7, 174 = 94.3, p <0.0001). On the contrary, normalization strongly reduced the interstudy variation in δ15N values in saprophages (Kruskal-Wallis test: H6, 102=25.0, p = 0.0003 and H6, 102 = 8.7, p = 0.067 for raw δ15N and LC-δ15N values, respectively; Fig. 2). In predators, the variability in the raw δ15N values was also much higher than in LC-δ15N values, although the difference among studies remained significant (Kruskal-Wallis test: H7, 174=58.9, p <0.0001 and H7, 174=37.7, p <0.0001, respectively).
The inter-study variation in δ13C and δ15N values was probably related both to the differences in the isotopic composition of plant litter and to the array of taxa studied in each case. Nevertheless, the data presented in Figs. 1 and 2 suggest that application of the litter-normalized δ13C values renders no significant positive effect in cross-studies comparisons, whereas the use of litter-normalized δ15N values largely compensates for the local variability in the δ15N values of soil and plant litter. This conclusion was verified by comparing the whole datasets of published and original data. All the published data (n = 421) were put into two isotopic bi-plots (raw δ15N vs raw δ13C values and LC-δ15N vs raw δ13C values). On each plot, an ellipse containing 95% of all samples (i.e. 401 of 421 points) was drawn as an area typically occupied by soil macroinvertebrates. Original data (n = 144) were added into each plot. If raw δ15N values were used, slightly less than 95% of added points fell into the anticipated ’typical’ area. If LC-δ15N values were used, 141 of 144 points (98%) lay within the ellipse. Moreover, samples were evenly distributed and their convex hull area nearly coincided with that of the ellipse containing 95% of the published data (Fig. 3). When both the LC-δ13C and the LC-δ15N values were plotted, only 89.6% of the original data remained within the 95% ellipse (not shown). In the dataset including both published and original data (n = 565), 95% of the cases showed raw δ13C values between 27.9 and 22.5‰, and LC-δ15N values between 0.8 and 9.6‰(Fig. 3). The 95% range of raw δ15N values was slightly wider: from 3.1 to 7.0‰. The mean δ15N values of local litter and of saprophagous animals correlated significantly (Pearson correlation across published and original data: R= 0.634, p = 0.011, n = 15), and normalization strongly decreased the variance in the mean δ15N values among studied sites (s2 = 4.84 and 2.99 for raw δ15N and LC-δ15N values, respectively). The range of the mean δ13C values in litter was considerably smaller than that f the mean δ15N values (3.7 and 6.6 units respectively, Figs. 1 and 2; Supplementary Table S1, Supporting Information). A positive correlation between the mean δ13C values in litter and saprophages (R= 0.663, p = 0.007, n = 15) was observed, mostly caused by the anomalously high δ13C values in the study of Halaj et al.[27] When this locality (#4 in Table 1) was removed, the correlation became much less pronounced (R= 0.522, p = 0.056, n = 14) while normalization of the δ13C values led to a slightly increased variance in the mean δ13C values of saprophages (s2 = 0.81 and 0.88 for raw δ13C and LC-δ13C values, respectively).
Animals with known trophic habits (276 published and 144 original cases) were separated into saprophages and predators. Although the two groups largely overlapped in the isotopic δ-space (Fig. 4(A)), their centroids were well separated (MANOVA: p <0.0001,Wilks’ lambda 0.64). Saprophages were
slightly enriched in 13C relative to predators (Fig. 4(B)). Across the whole dataset the mean difference from local plant litter (i.e. LC-δ13C values) averaged 3.5 ± 0.3 and 2.7 ± 0.2‰ in saprophages and predators, respectively (Table 2). On the other hand, saprophages were significantly less enriched in 15N than predators (the LC-δ15N values averaged 3.8 ± 0.5 and 6.6 ± 0.3‰, respectively; Fig. 4(C)). The difference in the median δ15N values between saprophages and predators averaged 2.8 ± 0.3‰(Table 2).
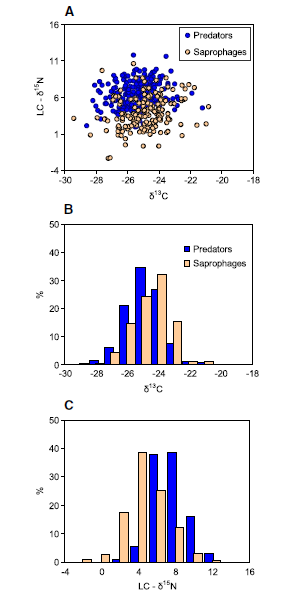
Figure 4. Isotopic bi-plot (A) and frequency distribution of raw δ13C (B) and litter-normalized δ15N values (C) of saprophagous (n = 174) and predatory (n = 246) soil animals.
DISCUSSION
The majority of primary production in terrestrial ecosystems is not consumed by herbivores, but enters detrital food webs. Dead organic matter is processed by soil microorganisms that in turn support an extremely diverse complex of soil animals.[30] Although some primary decomposers like epigeic earthworms or millipedes are able to assimilate dead organic matter directly, most of the ’saprophagous’ soil animals are in fact microbivorous.[31] Soil microorganisms strongly fractionate both 13C/12C and 15N/14N; in particular, sporocarps of ectomycorrhizal fungi are enriched in 15N, whereas those of saprotrophic fungi are enriched in 13C relative to plant litter.[24,32] In addition, the δ13Candδ15Nvalues of soil organic matter both usually increase down the soil profile,[33,34] this being reflected in a consistent difference in the isotopic composition of epigeic and endogeic earthworms.[16,35] Isotopic analysis of soil communities has shown that the δ15N values of animals increase from decomposers to primary and secondary predators,[2,19] but a strong variation in the isotopic signatures was found even among taxonomically related and ecologically similar species (e.g.[36]). These and other factors produce a relatively wide area occupied by soil macrofauna in the isotopic δ-space. The abundance of soil macroinvertebrates, but especially their availability to aboveground predators, can vary considerably during the season.[37–39] For example, epigeic and anecic earthworms formed a bulk food of thrushes in May, before the development of ground vegetation, but not in June, when birds switched to other preys.[40] Meanwhile, the isotopic signature of an animal reflects its diet integrated over a substantial time period.[5] The most dangerous error would be to overlook an important, but elusive food item that occupies a position near the edge of the whole isotopic space.[41] In the case of soil macrofauna, these can be endogeic earthworms that are often considerably enriched in 15N and 13C relative to other soil saprophages.[14,35,42] The availability of these animals to aboveground predators depends strongly on the season and the amount of precipitation.[43,44] These considerations suggest that revealing a full range of δ13C and δ15N values of potential prey species at a given locality would require significant efforts. As our analysis suggests, this information can be obtained from published studies. The whole community of soil macroinvertebrates occupies a rather well-defined isotopic space, which does not depend strongly on the isotopic composition of local soil and vegetation. Nevertheless, litter-normalized δ15N values are to be preferred for predicting the range of δ15N values of soil macroinvertebrates (Fig. 3). On the other hand, a site-specific normalization failed to decrease variation in δ13C values of soil animals across study sites, and is not therefore requiredwhen predicting the range of δ13C values in soil macroinvertebrates. As plants with C4 type of photosynthesis are typically absent from temperate forest, a strong inter-site variation in the mean δ13C values of vegetation is unlikely. In contrast, the carbon isotope composition of individual leaves is affected by their species identity and their position within the forest canopy,[45,46] and undergoes poorly known changes during the first stages of decomposition.[47] Therefore, an incorrect estimation of the ’mean’ δ13Clitter value is possible when only a few samples are analyzed. These difficulties are likely to outweigh a relatively small increase in precision (if any) when using litter-normalized δ13C values.
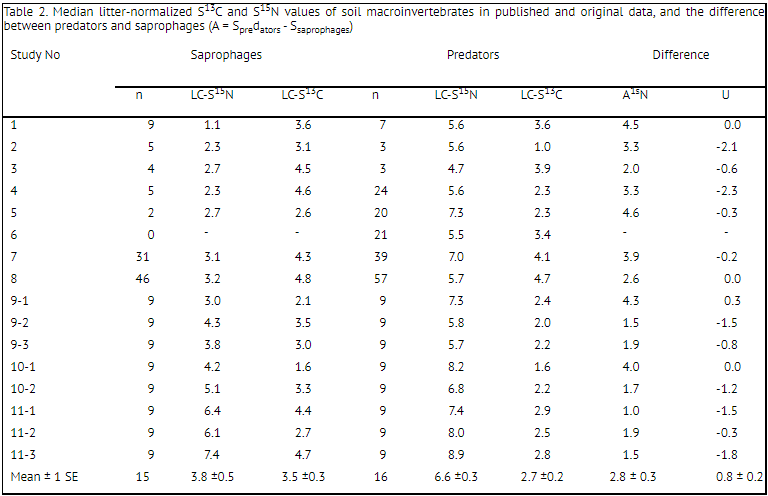
Table 2. Median litter-normalized S13C and S15N values of soil macroinvertebrates in published and original data, and the difference between predators and saprophages (A = Spredators - Ssaprophages)
Frequency distributions of isotopic values in two main trophic groups of soil animals highlight two important patterns. First, in spite of the huge variability in the normalized δ15N values within each trophic group and across different studies, the mean difference between neighboring trophic levels (i.e. between plant litter and saprophages or between saprophages and predators) lay within the anticipated 2–4‰ ’trophic enrichment’ in 15N per trophic level (Δ15N; Table 2).[3,48,49] Secondly, we confirmed a strong enrichment of saprophagous soil animals in 13C relative to plant litter (the median LC-δ13C values ranged from 1.6 to 4.8‰ at different sites). This enrichment has already been discussed in other reports,[14,19] and is probably related to the accumulation of 13C in microbial biomass, the main food source of soil saprophages.[50,51] A similar distribution of δ13C values of predators and saprophages (Fig. 4(B)) confirms that a detrital energy pathway predominates at the upper levels of soil food webs.[52] Phytophages also participate in the energy budget of predatory invertebrates, which are therefore slightly depleted in 13C compared with saprophages. Nevertheless, a unimodal distribution of δ13C values in predators suggests that detritus-based and plant-based energy pathways are tightly linked at higher levels of soil food webs.
CONCLUSIONS
Our analysis shows that, in spite of a considerable overlap, the difference in themean δ15N values between saprophages and predators averages 2.8‰. This fits the expected ’trophic enrichment’ among neighboring trophic levels. On the other hand, both saprophagous and predatory soil animals are strongly enriched in 13C compared with plant litter. This probably reflects the importance of saprotrophic microorganisms as the main energy source in soil food webs. The space occupied by soil macrofauna in the isotopic δ13C–δ15N bi-plot varies relatively little in different forest ecosystems and can roughly be predicted, based on the δ15N values of plant litter. In most cases, this prediction can be made even without knowledge of the litter isotopic composition, but the precision of the estimate would decrease.No site-specific normalization is usually required when predicting the range of δ13C values of soil macroinvertebrates in temperate forests. Acknowledgements We thank Dr L.M. Mukhametov, Head of the Utrish Marine Biological Station of the A.N. Severtsov Institute of Ecology and Evolution RAS, and Dr A.S. Shapovalov, Head of the Belogorye Nature Reserve, for allowing us to conduct field work. Isotope analyses were performed at the Joint Usage Center at the A.N. Severtsov Institute of Ecology and Evolution RAS. The study was supported by the Russian Foundation for Basic Research (Project Nos. 11-04-00245 and 14-04-01824). We thank S.I. Golovatch for improving the English of an advanced draft.
REFERENCES
[1] B. J. Peterson, B. Fry. Stable isotopes in ecosystem studies. Annu. Rev. Ecol. Evol. Syst. 1987, 18, 293.
[2] S. Scheu, M. Falca. The soil food web of two beech forests (Fagus sylvatica) of contrasting humus type: stable isotope analyses of a macro- and mesofauna-dominated commity. Oecologia 2000, 123, 285.
[3] A. V. Tiunov. Stable isotopes of carbon and nitrogen in soil ecological studies. Biol. Bull. 2007, 34, 395.
[4] W. J. Boecklen, C. T. Yarnes, B. A. Cook, A. C. James. On theuse of stable isotopes in trophic ecology. Annu. Rev. Ecol. Evol. Syst. 2011, 42, 411.
[5] C. Martinez del Rio, N. Wolf, S. A. Carleton, L. Z. Gannes.Isotopic ecology ten years after a call for more laboratory experiments. Biol. Rev. 2009, 84, 91.
[6] M. Ben-David, E. A. Flaherty. Stable isotopes in mammalian research: a beginner’s guide. J. Mammal. 2012, 93, 312.
[7] C. A. Layman,M. S. Araújo, R. Boucek, E.Harrison, Z. R. Jud, P. Matich, C. M. Hammerschlag-Peyer, A. E. Rosenblatt, J. J. Vaudo, L. A. Yeager, D. M. Post, S. Bearhop. Applying stable isotopes to examine food web structure: an overview of analytical tools. Biol. Rev. 2012, 87, 545.
[8] D. L. Phillips. Converting isotope values to diet composition: the use of mixing models. J. Mammal. 2012, 93, 342.
[9] S. D. Newsome, C. Martinez del Rio, S. Bearhop,D. L. Phillips. A niche for isotopic ecology. Front. Ecol. Environ. 2007, 5, 429.
[10] S. Scheu. Plants and generalist predators as links between the below-ground and above-ground system. Basic Appl. Ecol. 2001, 2, 3.
[11] D. A. Wardle, R. D. Bardgett, J. N. Klironomos, H. Setälä, W. H. Van der Putten,D.H.Wall. Ecological linkages between aboveground and belowground biota. Science 2004, 304, 1629.
[12] J. C. Moore, E. L. Berlow, D. C. Coleman, P. C. De Ruiter, Q. Dong, A. Hastings, N. C. Johnson, K. S. McCann, K. Melville, P. J. Morin, K. Nadelhoffer, A. D. Rosemond, D. M. Post, J. L. Sabo, K. M. Scow, M. J. Vanni, D. H. Wall. Detritus, trophic dynamics and biodiversity. Ecol. Lett. 2004. 7, 584.
[13] J. Halaj, D. H. Wise. Impact of a detrital subsidy on trophic cascades in a terrestrial grazing food web. Ecology 2002, 83, 3141.
[14] M. M. Pollierer, R. Langel, S. Scheu, M. Maraun. Compartmentalization of the soil animal food web as indicated by dual analysis of stable isotope ratios (15N/14N and 13C/12C). Soil Biol. Biochem. 2009, 41, 1221.
[15] C. Melody, O. Schmidt. Northward range extension of an endemic soil decomposer with a distinct trophic position. Biol. Lett. 2012, 8, 956.
[16] A. F. Darling, E. M. Bayne. The potential of stable isotope (δ13C, δ15N) analyses formeasuring foraging behavior of animals in disturbed boreal forest. Ecoscience 2010, 17, 73.
[17] E. A. Flaherty, M. Ben-David, W. P. Smith. Diet and food availability: implications for foraging and dispersal of Prince of Wales northern flying squirrels across managed landscapes. J. Mammal. 2010, 91, 79.
[18] E. A. Flaherty, M. Ben-David. Overlap and partitioning of the ecological and isotopic niches. Oikos 2010, 119, 1409.
[19] S. Ponsard, R. Arditi. What can stable isotopes (δ15N and δ13C) tell about the food web of soil macro-invertebrates? Ecology 2000, 81, 852.
[20] T. E. Dawson, S. Mambelli, A. H. Plamboeck, P. H. Templer, K. P. Tu. Stable isotopes in plant ecology. Annu. Rev. Ecol. Syst. 2002, 33, 507.
[21] J. M. Craine, A. J. Elmore, M. P. M. Aidar, M. Bustamante, T. E. Dawson, E. A. Hobbie, A. Kahmen, M. C. Mack, K. K. McLauchlan, A. Michelsen, G. B. Nardoto, L. H. Pardo, J. Penuelas, P. B. Reich, E. A. G. Schuur, W. D. Stock, P.H. Templer, R. A. Virginia, J. M. Welker, I. J. Wright. Global patterns of foliar nitrogen isotopes and their relationships with climate, mycorrhizal fungi, foliar nutrient concentrations, and nitrogen availability. New Phytol. 2009, 183, 980.
[22] K. Schneider, S. Migge, R. A. Norton, S. Scheu, R. Langel, A. Reineking, M. Maraun. Trophic niche differentiation in soil microarthropods (Oribatida, Acari): evidence from stable isotope ratios (15N/14N). Soil Biol. Biochem. 2004, 36, 1769.
[23] M. Chahartaghi, R. Langel, S. Scheu, L. Ruess. Feeding guilds in collembolan based on nitrogen stable isotope ratios. Soil Biol. Biochem. 2005, 37, 1718.
[24] J. D. Mayor, E. A. G. Schuur, T. W. Henkel. Elucidating the nutritional dynamics of fungi using stable isotopes. Ecol. Lett. 2009, 12, 171.
[25] J. Seeber, G. U. H. Seeber, W. Kossler, R. Langel, S. Scheu, E. Meyer. Abundance and trophic structure of macrodecomposers on alpine pastureland (Central Alps, Tyrol): effects of abandonment of pasturing. Pedobiologia 2005, 49, 221.
[26] K. F. Abd El-Wakeil. Trophic structure of macro- and mesoinvertebrates in Japanese coniferous forest: Carbon and nitrogen stable isotopes analyses. Biochem. Syst. Ecol. 2009, 37, 317.
[27] J. Halaj, R. W. Peck, C. G. Niwa. Trophic structure of a macroarthropod litter food web in managed coniferous forest stands: a stable isotope analysis with δ15N and δ13C. Pedobiologia 2005, 49, 109.
[28] A. A. Goncharov, A. I. Kuznetsov, L. M. Dyakov, A. V. Tiunov. Isotopic evidence of trophic links of terrestrial and aquatic food webs in Oksky Nature Reserve. Izvestiya Penzenskogo gosudarstvennogo pedagogicheskogo universiteta imeni V.G. Belinskogo 2011, 25, 333 (in Russian).
[29] Y. Okuzaki, I. Tayasu, N. Okuda, T. Sota. Vertical heterogeneity of a forest floor invertebrate food web as indicated by stable-isotope analysis. Ecol. Res. 2009, 24, 1351.
[30] D. A. Wardle. Communities and Ecosystems: Linking the Aboveground and Belowground Components. Princeton University Press, Princeton, 2002.
[31] M. J. Swift, O. W. Heal, J. M. Anderson. Decomposition in Terrestrial Ecosystems. Studies in Ecology 5. Blackwell Scientific Publications, Oxford, 1979.
[32] M. R. Henn, I. H. Chapela. Ecophysiology of 13C and 15N isotopic fractionation in forest fungi and the roots of the saprotrophic-mycorrhizal divide. Oecologia 2001, 128, 480.
[33] J. G. Wynn. Carbon isotope fractionation during decomposition of organic matter in soils and paleosols: Implications for paleoecological interpretations of paleosols. Palaeogeogr. Palaeoclim. Palaeoecol. 2007, 251, 437.
[34] E. A. Hobbie, A. P. Ouimette. Controls of nitrogen isotope patterns in soil profiles. Biogeochemistry 2009, 95, 355. [35] R. Neilson, B. Boag, M. Smith. Earthworm δ13C and δ15N analyses suggest that putative functional classifications of earthworms are site-specific and may also indicate habitat diversity. Soil Biol. Biochem. 2000, 32, 1053.
[36] M. Maraun, G. Erdmann, B. M. Fischer, M. M. Pollierer, R. A. Norton, K. Schneider, S. Scheu. Stable isotopes revisited: Their use and limits for oribatid mite trophic ecology. Soil Biol. Biochem. 2011, 43, 877.
[37] R. S. Sikes, G. A. Heidt, D. A. Elrod. Seasonal diets of the nine-banded armadillo (Dasypus novemcinctus) in a northern part of its range. Am. Midl. Nat. 1990, 123, 383.
[38] N. Ferrari, J. Weber. Influence of the abundance of food resources on feeding habits of the red fox, Vulpes vulpes, in western Switzerland. J. Zool. 1995, 236, 117.
[39] E. Baubet, Y. Ropert-Coudert, S. Brandt. Seasonal and annual variations in earthworm consumption by wild boar (Sus scrofa scrofa L.). Wildlife Res. 2003, 30, 179.
[40] S. E. Cherenkov, I. Y. Gubenko,A. V. Tiunov,A. Y. Kuzmichev. Factors determining the spatial distribution of thrushes (Turdus spp.) in highly mosaic forest landscapes. Zool. Zh. 1995, 74, 104 (in Russian).
[41] D. L. Phillips, J. W. Gregg. Source partitioning using stable isotopes: coping with too many sources. Oecologia 2003, 136, 261.
[42] T. Uchida, N. Kaneko, M. T. Ito, K. Futagami, T. Sasaki, A. Sugimoto. Analysis of the feeding ecology of earthworms (Megascolecidae) in Japanese forests using gut content fractionation and δ15N and δ13C stable isotope natural abundances. Appl. Soil Ecol. 2004, 27, 153.
[43] S. A. Bengtson, S. Rundgren, A. Nilsson, S. Nordstrom. Selective predation on lumbricids by golden plover Pluvialis apricaria. Oikos 1978, 31, 164.
[44] E. Ludvig, L. Vanicsek, J. Torok, T. Csorgo. Seasonal variation of clutch size in the European blackbird Turdus merula: A new ultimate explanation. J. Anim. Ecol. 1995, 64, 85.
[45] N. Buchmann, W. Kao, J. R. Ehleringer. Influence of stand structure on carbon-13 of vegetation, soils, and canopy air within deciduous and evergreen forests of Utah (USA). Oecologia 1997, 110, 109.
[46] P.Högberg,A.H. Plamboeck,A. F. S. Taylor, P.M.A. Fransson. Natural 13C abundance reveals trophic status of fungi and host – origin of carbon in mycorrhizal fungi in mixed forests. Proc. Natl. Acad. Sci. 1999, 96, 8534.
[47] O. L. Shilenkova, A. V. Tiunov. Soil-litter nitrogen transfer and changes in δ13C and δ15N values in decomposing leaf litter during laboratory incubation. Pedobiologia 2013, 56, 147.
[48] D. M. Post. Using stable isotopes to estimate trophic position: models, methods, and assumptions. Ecology 2002, 83, 703.
[49] M. A. Vanderklift, S. Ponsard. Sources of variation in consumer-diet δ15N enrichment: a meta-analysis. Oecologia 2003, 136, 169.
[50] A. M. Potapov, E. E. Semenina, A. V. Kurakov, A. V. Tiunov. Large 13C/12C and small 15N/14N isotope fractionation in an experimental detrital foodweb (litter-fungi-collembolans). Ecol. Res. 2013, 28, 1069.
[51] W. Yang, J. Magid, S. Christensen, R. Rønn, P. Ambus, F. Ekelund. Biological 12C–13C fractionation increases with increasing community-complexity in soil microcosms. Soil Biol. Biochem. 2014, 69, 197.
[52] F. Hyodo, A. Kohzu, I. Tayasu. Linking aboveground and belowground food webs through carbon and nitrogen stable isotope analyses. Ecol. Res. 2010, 25, 745.
SUPPORTING INFORMATION
Additional supporting information may be found in the online version of this article at the publisher's website.