


Zhanna V. Filimonova, Fyodor A. Savin
A.N. Severtsov Institute of Ecology and Evolution, Russian Academy of Sciences, Leninsky Prospect 33, Moscow 119071, Russia
Received 18 October 2002; received in revised form 1 September 2003; accepted 3 September 2003
Abstract
The bait-lamina test was developed for estimating soil biotic activity in arable and contaminated soils. To investigate the utility of the test in unpolluted soils under various climatic and soil conditions, three plots along a north-south gradient in the European part of Russia were chosen. They are: (i) a pine forest at the White Sea coast on poorly developed podzolic soils (Karelia Region); (ii) a spruce forest near Borovsk (Kaluga Region) on podzolic soils; and (iii) oak-beech forest near Novorossiysk, on the Black Sea coast with brown soils (Krasnodar Region). Forty bait-laminas were used at each plot and checked at various times of exposure. Parallel sampling to investigate soil macrofaunal diversity was carried out. Litter and small stone mass, water-holding capacity (WHC), loss on ignition (LOI) and pH were determined in every soil sample in the laboratory.
Differences in bait-lamina perforation over time were observed and it was concluded that a 10-day exposure is appropriate under most conditions. Great differences in bait-lamina perforation were found between soil types. An optimal combination of climatic factors (Borovsk plot) reflected by Budyko’s drought index corresponded with the highest feeding activity (65%
of pierced apertures), although the abundance of soil macrofauna was only 287 individuals m-2. The Novorossiysk plot had higher densities of soil invertebrates (1380 individuals m-2), but they showed a lower trophic activity (27%), comparable to that of the White Sea cost plot (14%). The depth distribution of bait-lamina perforation varied from plot to plot, but maximal activity was always observed at a depth 0-4 cm from the soil surface, which was supported by a proposed index of average depth of tropic activity. Vertical distribution of bait-lamina perforation depended mostly on soil profile structure and climatic conditions.
© 2003 Elsevier B.V. All rights reserved.
1. Introduction
Soil biota, as one of the essential components which regulate ecosystem functioning, is considered to be a valuable indicator of climatic fluctuations in the scope of the global climate change problem (van Straalen, 1998; Wardle et al., 1998; Wolters et al., 2000; Walther et al., 2002). The activity of soil fauna may be one of the basic parameters, liable to change as abiotic environmental conditions alter. To predict the effects of potential environmental change on soil biota baseline information on the actual situation in soil ecosystems is required. A unique north-south gradient of nature zones in the European part of Russia, which had been studied by many scientists, allows tracking of changes in soil biota along natural gradients of abiotic factors (Grigoriev, 1954; Ghilarov, 1965; Ghilarov and Chernov, 1975).
One of the methods recently introduced into soil biology, is the bait-lamina test developed by von Tome (1990a,b). It is a measure of invertebrates “feeding” activity and has been widely used for assessing soil disturbance (especially contamination) in ecotoxicological studies (Larink, 1993; Kula and Rombke, 1998; Paulus et al., 1999; Keplin and Htittl, 2000). As Kratz (1998) concluded, microbial activity cannot contribute to perforation of a bait during the period of exposure generally used, which normally varies from 7 to 20 days depending on soil moisture (von Tome, 1990a; Kratz, 1998). The only result of microbial impact may be thinning and then artifact destruction of the bait. However, if results of studies of feeding activity in different soil types are to be compared, selection of optimal exposure periods and principle factors affecting test objectivity should be defined. Bait-lamina test results are dependent on soil moisture and temperature (Larink, 1993; Meyer, 1996; Gongalsky et al., 2003).
The aim of this study was to compare the dynamics of bait-lamina perforation over a period of 2 weeks in three different undisturbed forest ecosystems and to estimate how this parameter is influenced by soil macrofauna and selected abiotic factors.
2. Materials and methods
The study was carried out in the European part of Russia in 2000, in three plots along a north-south geographic gradient. The sampling period for each plot was set in local midsummer in accordance with the flowering times of bird cherry trees (Padus racemosa). Phenological as well as climatic data used were taken from the Atlas of the USSR (1984). The aridity index of Budyko (1977) was used as a measure of climatic favourableness,

where Rn is the annual sum of net solar radiation, L the latent heat and P the precipitation. The index was proposed to characterize general environmental conditions and processes on the Earth’s surface. It approximates the ability of precipitation to provide the water required by native vegetation for an undisturbed evapotranspiration process and is often used in ecological studies (Hendersen-Sellers, 1996; Arora, 2002).
The index varies from 0 (extremely high moisture, as in arctic wetlands) to values above 3 (extremely low moisture, tropical deserts), while the optimal conditions are described by a value of 1.0. Another favourability index (A) describing conditions for soil-living invertebrates was also used (Krivolutsky, 1967). This index is calculated according to the equation:
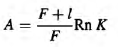
where F is the annual litterfall, I the dry litter mass, Rn the annual sum of net solar radiation, and К is the moisture index (the ratio of annual precipitation to evaporation). Plot 1 is a pine (Pinus sylvestris) forest on peaty podzolic, poorly developed soils formed on granite rocks at an altitude of about 20 m above sea level situated close to the White Sea Biological Station (WSBS) of Moscow State University (Republic of Karelia, 66°33'N, 33°05'E) (Fig. 1). The depth of the peaty (organic) layer was 6-8 cm and the mineral layer comprised coarse sand (2-4 cm above bedrock). The soil was acid (mean pH value is 3.28) with high water-holding capacity (WHC) (603.1%) (Table 1). The organic matter content in this soil was the highest among the three studied plots (LOI = 75.8%). Mean annual precipitation here is approximately 600 mm, mean July temperature is 12 °C; the beginning of the bird cherry flowering is 20 June. The Budyko index value is 0.4. Sampling was carried out between 1 and 15 August 2000. Plot 2 is a Norway spruce (Picea abies) forest on gray-brown podzolic soils near the city of Borovsk, approximately 100 km south of Moscow (Kaluga Region, 55°13/N, 36°22'E). The soil was less acidic (pH = 4.19). The water-holding capacity (72.0%) and organic matter (6.01%) were lower than at the White Sea plot. Mean annual precipitation is 600 mm; mean July temperature is 16 °C, bird cherry flowering usually begins on 21 May. The Budyko index is about 1.0. Sampling was done on 5-18 July 2000.
Plot 3 is an oak (Quereus pubescens)—beech (Carpinus orientalis) forest on brown-pebble forest soils near the village of Maly Utrish, 30 km from
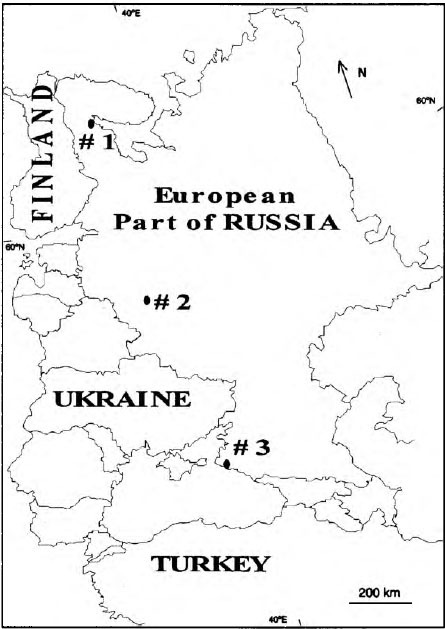
Table 1
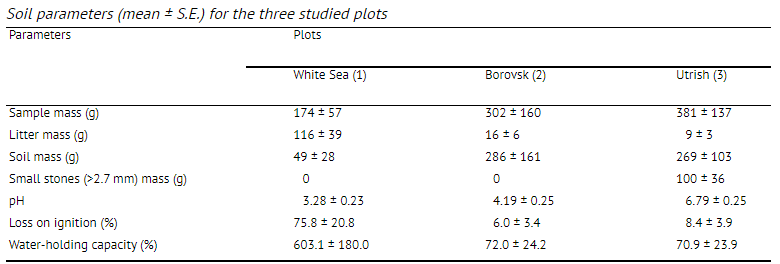
Novorossiysk (Krasnodar Region, 44°44'N, 37°26/E) at an altitude of 50 m above sea level (3 km from the Black Sea coast). The soil organic matter content (LOI) was 8.39% and the WHC 70.9%, the soil pH was near neutral (6.79). In Utrish, small stones and pebbles comprised a substantial portion of the soil reaching up to 84% of the sample’s mass (Table 1). Mean annual precipitation is 500 mm, mean July temperature is 20 °C; bird cherry trees start flowering on 21 April. The Budyko index value is approximately 1.5. Sampling was carried out between 11 and 24 June 2000. We used bait-laminae 16 cm long and 0.5 cm wide made of hard plastic with 16 apertures (inner diameter 1.5 mm) along the strip (with 5 mm distance between them) (von Torne, 1990a). The apertures were filled with a wet mixture of pure microcrystallic cellulose powder and nettle (Urtica dioica) leaf powder in the ratio of 7:3, respectively. Then they were dried for 2 days at room temperature. Bait-laminae (40 strips) were inserted into the soil in four lines (distance between lines—60 cm; between strips 12-15 cm) as described by von Torne (1990a). The laminae were checked on the 3rd, 5th, 7th, 10th and 14th day after
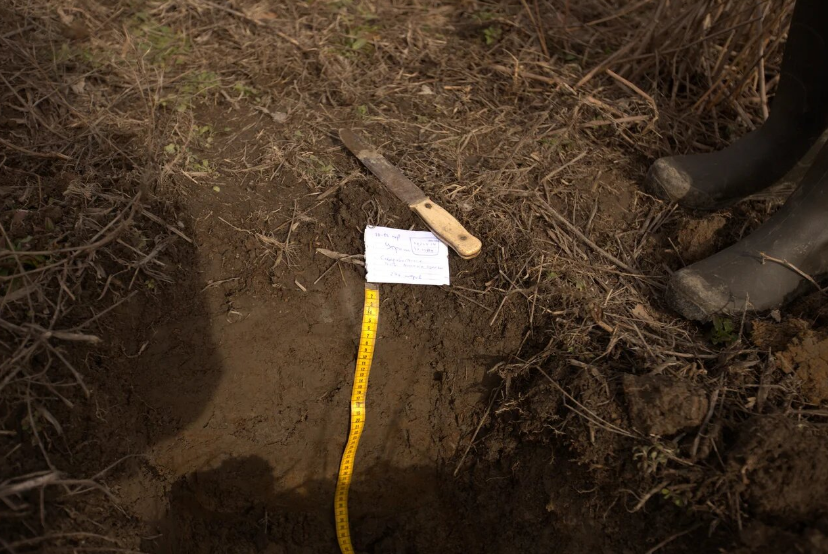
starting the exposure. Each lamina was removed from the soil, perforated apertures were counted and it was replaced in the soil in the same place. Laminae handling effects were estimated at the start of the experiments by pushing a control strip into the soil and pulling it out again, as proposed by von Torne (1990a). Simultaneously, soil samples were taken, ca. 5-10 m away from the bait-lamina plot to estimate abundance of soil macrofauna. At each plot, 144 intact soil cores were taken to a depth of 8-12 cm. Each core had an area of 76 cm2. On every plot sample locations formed a grid of 24 x 6 units in order to determine animal spatial distribution. Samples were placed into separate marked plastic bags and then hand-sorted in the laboratory. Litter, soil and small stone (fraction > 2.7 mm) mass, water-holding capacity, pH and loss on ignition (LOI) were measured in every soil sample using standard methods (Arinushkina, 1970; Schinner et al., 1996) in the laboratory. We used descriptive statistics and the Mann-Whitney U-test for data analysis. Statgraphics Plus 3.0 for Windows (Statistical Graphics Corp.) and Statistica 6.0 for Windows software were applied (StatSoft Inc., 2001). Correspondence analysis (CA) was performed with the help of BioDiversity Pro 2.0 software (NHM and SAMS, 1997). Significance level for P in our study was 0.05. For each site and each checking day an index of average depth of trophic activity was applied. This index, proposed by N.M. van Straalen (personal communication), was calculated as follows:
3. Results
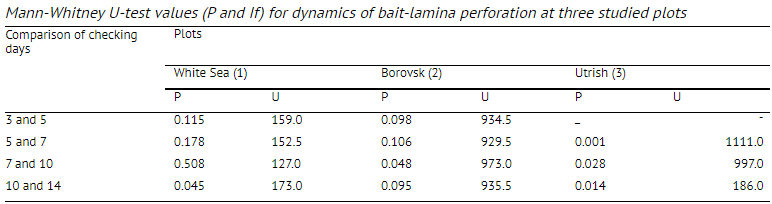
The proportion of apertures perforated in the bait-lamina test after 2 weeks at the White Sea Biological Station (plot 1) was 13.9%. The dynamics of feeding activity (perforation) over time was uneven and its vertical distribution showed low activity of animals at a depth of 45-65 mm, in the middle of the organic layer (Fig. 2). According to the f/-test, differences in total feeding activity (perforation) became significant between the 10th and 14th days due to the almost complete absence of activity in the period between the 7th and 10th days (Table 2, Fig. 2). The 17-test indicated a significant difference in trophic activity (P = 0.0098) between the upper and lower 4 cm soil layers after 14 days of laminae exposure. The density of soil macroinvertebrates in this plot was rather low, 174.3 ±12.4 individuals m~2 (Table 3), the
Table 2
the experiment.
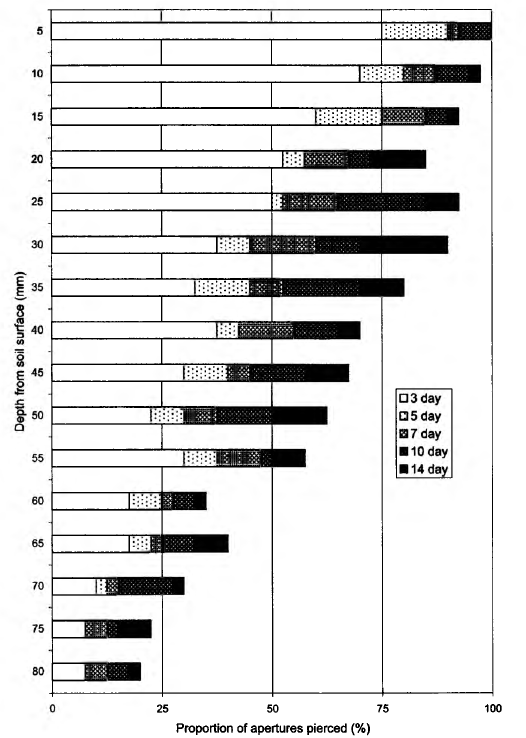
greatest part consisting of predaceous animals, which feed on microarthropods and other small animals. Bait perforation in podzolic soils (plot 2, Borovsk) was the highest of the investigated plots (Fig. 3); by the 3rd day of exposure, some bait-laminae were already completely perforated. The proportion of pierced apertures after 2 weeks was 65.2%. According to the (7-test, there was a significant difference in bait perforation between the 7th and 10th days of bait-laminae exposure, but not between the 10th and
Table 3
Abundance of soil macrofaunal taxonomic groups (individuals m-2 ± S.E.) in three types of forest soils
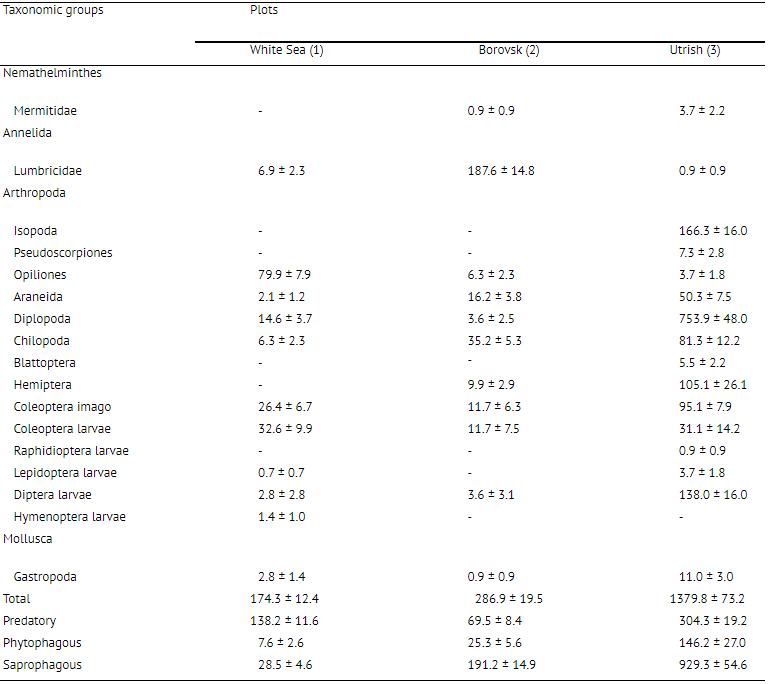
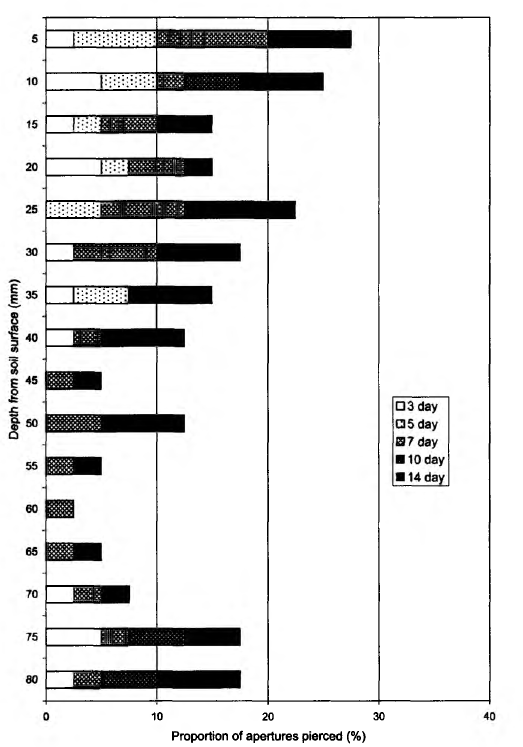
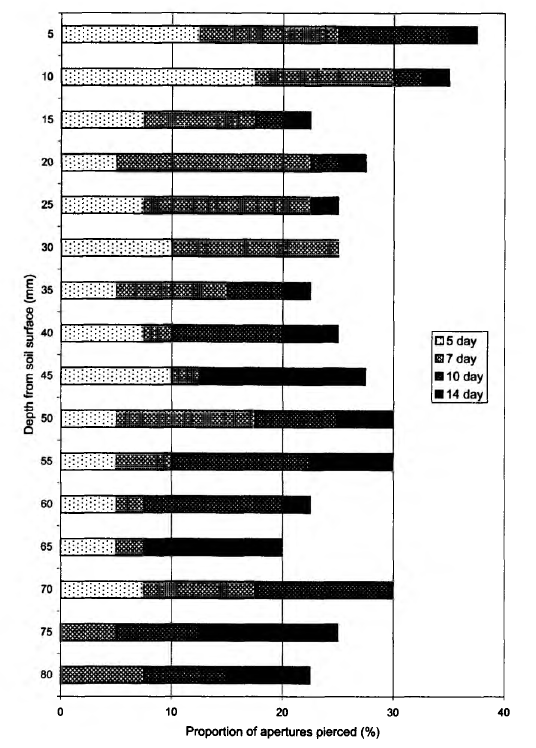
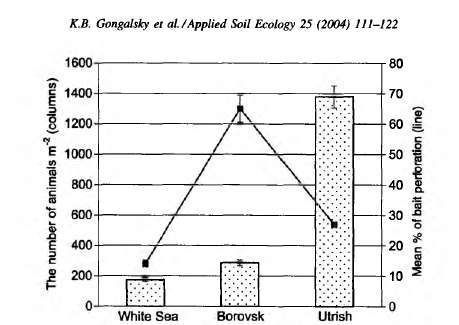
14th days (Table 2). There were no significant differences between checking days for either the upper or lower 4 cm layers considered separately. The vertical distribution of bait perforation showed a decrease of rate of piercing activity with depth. The f/-test indicated a significant difference in trophic activity (P = 0.0004) between the 4 cm soil layers by the end of the study. The soil in this plot was inhabited by more animals (286.9 ± 19.5 individuals m-2), than the White Sea Biological Station plot and a high density of earthworms was observed here (Table 3). On the Utrish plot (plot 3) total feeding activity (perforation) at the end of observations was 26.7% (Fig. 4). In contrast with the first two plots on the 3rd day of exposure no perforation appeared. Trends in total bait perforation were similar to the White Sea plot: the differences were significant for all intervals between checking days (Table 2). The rate of the activity at various soil depths (upper and lower 4 cm layers) differed significantly after 7 and 10 days of exposure (U-test: P = 0.001 at the 7th day and 0.040 at the 10th day). Vertical distribution of bait perforation showed relatively high activity in the 10 mm surface layer and two minima of perforation in layers 15-40 and 60-65 mm (Fig. 4). There was no significant difference in trophic activity (P — 0.2671) between upper and lower 4 cm soil layers after 14 days of laminae exposure according to the Mann-Whitney i/-test. In the Utrish plot the density of macrofauna (1380 ± 73 individuals m~2) was 8.2 and 5.0 times higher than that at the White Sea and Borovsk plots, respectively. Isopoda, Pseudoscorpiones, Blattoptera and Raphidioptera larvae were recorded only on this plot (Table 3). The abundance of Diplopoda in Utrish was 139 and 24 times higher than in the White Sea and Borovsk plots, respectively. However, most of the animals in the Utrish soil were small, especially diplopods represented by the species Polyxenus lagurus, P. pontiacus and Cylindroiulus placidus.
Borovsk) during the experiment.
the experiment.
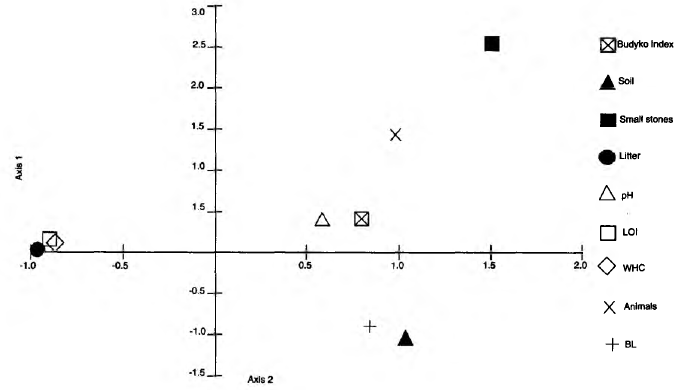
There was no relationship between bait-lamina perforation and macrofaunal abundance in the three sites (Fig. 5). The correspondence analysis of the factors influencing bait-lamina perforation (Fig. 6) revealed correlation between litter, LOI and WHC. Bait-lamina perforation and soil fraction mass data were grouped in the same quadrant of CA, but not with invertebrate abundance (Fig. 6), indicating the stronger effect of abiotic rather then biotic factors.
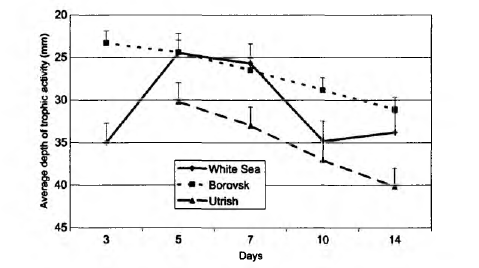
The average depth of trophic activity varied from 23.3 to 40.2 mm depending on site (Fig. 7). The index (D) shows that in Utrish more favourable conditions for invertebrates occur in deeper layers than in the other sites to the north. The index increases with the duration of time even in the most optimal conditions (plot 2), although it had an increase in White Sea site by the 5th and 14th days of the experiment.
gradient.
4. Discussion
4.1. Bait-lamina perforation in a north-south gradient
In the northernmost location (White Sea), the mean feeding activity of soil organisms, as indicated by bait-lamina perforation, was comparable with that in the other plots. An explanation of high activity despite severe conditions and low macrofaunal abundance may be that we measured trophic activity during the most favorable season. Although the shortness of the summer period and low winter temperatures do not allow organisms from certain groups (for example, Isopoda, Pseudoscorpiones) to develop the ones adapted to such environments seem to show high activity. It is mainly mesofauna, which have a high abundance here (Byzova et al., 1986) in comparison with other nature zones (Ghilarov, 1965; Petersen and Luxton, 1982). Possibly this group contributed to the observed bait-lamina perforation level. Despite contrasting conditions in Utrish, feeding activity of soil animals was similar to that on the White Sea coast. This was probably due to the low abundance of earthworms in soil here (0.9 ± 0.9 individuals m-2 ). These animals are known to avoid soils with a high stone content (Edwards, 1977). Among all three plots at different latitudes, the optimal climatic conditions, according to Budyko (1977), were in Borovsk. Krivolutsky (1967) showed that the highest biomass of oribatid mites was observed in the coniferous forest zone, where the index of favourability (A) was approaching maximal values. The maximal bait-lamina perforation was observed in the same forest zone. The level of bait-lamina perforation in the Borovsk plot was close to the highest values observed in previous studies (von Tome, 1990a; Koehler, 1993; Larink, 1994).
Temporal changes in bait-lamina perforation within a plot provided further insight into the trophic activity of soil biota. General trend became apparent after the first checks. In the Borovsk plot, all baits in some laminae were pierced already by the 3rd day of exposure, while no signs of activity appeared at the same time in the Utrish plot (Figs. 3 and 4). These data indicate a high level of faunal activiy in the Borovsk plot, but could also mean that other sites with higher organic matter content had a greater availability of food (Table 1). That could make bait-laminae less attractive. Before choosing any of these two hypotheses additional investigations are needed, but the first possibility was partially confirmed by continued observation. At the Borovsk plot 7 days exposure was sufficient to obtain statistically significant results while at the other two plots a 10-day period was needed. Thus, 10 days was a sufficient period for assessing feeding activity of soil biota at any of the investigated plots. This confirms data from recent studies by Kratz (1998), but does not agree with the original duration proposed by von Tome (1990a).
Abiotic factors seem to be much more important or explanation of bait-lamina test perforation results than abundance and biodiversity of soil macrofauna. Large differences in soil invertebrate abundance between the sites were not correlated with their activity (Figs. 5 and 6): maximal activity was observed under conditions with an optimal combination of temperature and moisture parameters. Density of soil mesofauna is relatively high in the soil of the White Sea plot (Krivolutsky, 1967; Byzova et al., 1986) and low in the Utrish soil (Krivolutsky, 1995).
4.2. Stratification o f bait-lamina perforations
The depth distribution of the bait-lamina perforation in different plots was similar, indicating that trophic activity in the upper 4 cm layer of soil was higher than in the lower 4 cm layer. This trend was more distinct in plots 1 and 2 than in plot 3. The type of stratification at the Borovsk plot, where the activity smoothly decreased with the soil depth, was very close to that usually observed in central Europe (von Torne, 1990a; Larink and Liibben, 1991). The dynamics of bait-lamina perforation seemed to depend on plot temperature and moisture, while their depth distribution was connected mostly to soil texture and profile features. In particular, the general shape of Fig. 2 is possibly determined by the fact that soil at the White Sea plot is poorly developed and thin. Bedrock was found at a depth of 8-12 cm. Lack of perforation activity in the 45-65 mm layer in the soil suggests that bait-laminae were perforated by two groups of organisms: those that live in the upper level of soil and in litter, and those that live close to the bedrock surface, although we did not focus on animal vertical stratification while sampling. Wetter conditions in the lower layer may also be the factor stimulating activity of soil animals. In contrast in plot 3, soil texture may be an important factor influencing bait-lamina perforation. Small stones on average made up to 70% of a sample mass, leaving not much space for invertebrates in the upper soil layer. Because of soil texture animals were evenly distributed in the upper 10-20 cm. Small diplopods, the most common group in the Utrish plot, can be found down to a depth of 50 cm (Ghilarov, 1965; Dunger, 1974), thus distribution of space for living may be the most important factor determining their vertical distribution. We assume that soil texture was a factor leading to almost no stratification of trophic activity in the southernmost soil (Fig. 3). This was partially supported by the average depth of trophic activity (D), which was in this site the closest to the middle of a bait-lamina (4 cm depth). Since the index increases with the duration of time, the slope of the curve can give more information about average depth of trophic activity in future comparative studies.
4.3. Conclusions
Bait-lamina perforation was highest under the most optimal climatic conditions. Despite the fact that the Southern brown soils showed higher densities of macrofauna populations, their activity as indicated by the bait-lamina test was very low. Feeding activity varied with soil depth; the maximum was recorded at a depth of 0-4 cm from the soil surface. We believe that soil texture influenced the stratification of feeding activity. The minimal time of bait-lamina test exposure for gaining significant results is 10 days.
Acknowledgements
We are grateful to Dr. Werner Kratz (Free University, Berlin) and to Dr. Roman G. Kuperman (Geo-Centers, Baltimore) for providing the bait-laminae for the study, and late Dr. Nikolai A. Klyuev (Institute of Ecology and Evolution, Moscow) for analytical support. We gratefully acknowledge Prof. Nico M. van Straalen (Free University, Amsterdam) and two anonymous referees for valuable review of the manuscript. The work was partially supported by Russian Foundation for Basic Research (projects 01-04-06227 and 03-05-64127) and NATO Linkage Grant EST.CLG.978832.
References
Arinushkina, E.V., 1970. Manual for Chemical Analysis of Soils. Moscow University Press, Moscow, 487 pp. (in Russian).
Arora, V.K., 2002. The use of the aridity index to assess climate change effect on annual runoff. J. Hydrol. 265, 164-177.
Budyko, M.I., 1977. Global Ecology. Mysl, Moscow, 327 pp. (in Russian).
Byzova, Yu.B., Uvarov, A.V., Gubina, V.G., Zalesskaya, N.T., Zakharov, A.A., Petrova, A.D., Suvorov, A.A., Vorobyeva, E.G., 1986. Soil invertebrates of White Sea Islands of Kandalaksha Reserve. Nauka, Moscow, 312 pp. (in Russian).
Dunger, W„ 1974. Here im Boden. A. Ziemsen Verlag, Wittenbeig, 265 pp.
Edwards, C.A., 1977. Investigations into the influence of agricultural practice on soil invertebrates. Ann. Appl. Biol. 87, 515-520.
Ghilarov, M.S., 1965. Zoological Methods in Soil Diagnostics. Nauka, Moscow, 278 pp. (in Russian).
Ghilarov, M.S., Chernov, Yu.I., 1975. Soil invertebrates in the communities of temperate zone. In: Rodin, L.E., Smirnov, N.N. (Eds.), Resources of the Biosphere, vol. 1. Nauka, Moscow, pp. 218-240 (in Russian).
Gongalsky, K.B., Pokarzhevskii, A.D., Savin, F.A., Filimonova, Z.V., 2003. Spatial distribution of animals and variability of trophic activity, measured by bait-lamina test, in grass-podzol soil under a spruce forest Russ. J. Ecol., 34 (in press).
Grigoriev, A.A., 1954. Geographical zoning and some of its features, Izvestia AN SSSR. Ser. Geogr. 5, 17-39 (in Russian).
Hendersen-Sellers, A., 1996. Soil moisture: a critical focus for global change studies. Global Planetary Change 13, 3-9.
Keplin, B„ Hiittl, R.F., 2000. Bestimmung der biologischen Aktivitat von rekultivierten kippboden mit dem Koderstreifentest. Forstwissenschaftliches Centralblatt 119, 150-159.
Koehler, H., 1993. Erfahrungen mit dem K6derstreifen-Test nach Tome. Mitteilungen der Deutschen Bodenkundlichen Gesellschaft 69, 143-146.
Kratz, W., 1998. The bait-lamina test—general aspects, applications and perspectives. Environ. Sci. Pollut. Res. 5, 94-96. Krivolutsky, D.A., 1967. Some regularities in zonal distribution of oribatid mites. Oikos 19, 339-344.
Krivolutsky, D.A. (Ed.), 1995. Oribatid Mites. Nauka, Moscow, 224 pp. (in Russian).
Kula, C., Rombke, J., 1998. Evaluation of soil ecotoxicity tests with functional endpoints for the risk assessment of plant protection products. Environ. Sci. Pollut. Res. 5, 55-60.
Larink, O., 1993. 1st der Koderstreifentest ein Мав fur bodenzoologische AktivitSt? Mitteilungen der Deutschen Bodenkundlichen Gesellschaft 69, 139-142.
Larink, O., 1994. Der Kederstreifen-Test in der Pflanzenschutzmittel-Prttfung. Braunschweiger Naturkundliche Schriften 4, 671-674.
Larink, O., Liibben, B., 1991. Bestimmung der biologischen Aktivitat von Boden mit der K6derstreifen-Test nach v. Tоme: eine Erfahrungsbericht. Mitteilungen der Deutschen Bodenkundlichen Gesellschaft 66, 551-554.
Meyer, E., 1996. Functional activity of soil animals. In: Schinner, F., Ohlinger, R„ Kandeler, E., Margesin, R. (Eds.), Methods in Soil Biology. Springer, Berlin, pp. 362-363.
NHM and SAMS, 1997. BioDiversity Professional, Version 2.0. The Natural History Museum and Scottish Association for Marine Science.
Paulus, R., Rombke, J., Ruf, A., Beck, L., 1999. A comparison of the litterbag-, minicontainer- and bait-lamina-methods in an ecotoxicological field experiment with diflubenzuron and btk. Pedobiologia 43, 120-133.
Petersen, H., Luxton, M.A., 1982. A comparative analysis of soil fauna populations and their role in decomposition processes. Oikos 39, 287-388.
Schinner, F., Ohlinger, R„ Kandeler, E., Margesin, R. (Eds.), 1996. Methods in Soil Biology. Springer, Berlin, 426 pp.
StatSoft Inc., 2001. STATISTICA, Version 6. //www.statsoft.com.
USSR (Atlas of the USSR), 1984. GUGK Moscow, 260 pp. (in Russian).
van Straalen, N.M., 1998. Evaluation of bioindicator systems derived from soil arthropod communities. Appl. Soil Ecol. 9, 429-437.
von Torne, E„ 1990a. Assessing feeding activities of soil-living animals. Bait-lamina-tests. Pedobiologia 34, 89-101.
von Torne, E„ 1990b. Schatzungen der FreBaktivitaten bodenlebender Here. II. Mini-Koder-Test. Pedobiologia 34, 269-279.
Walther, G.-R., Post, E., Convey, P., Menzel, A., Parmesan, C„ Beebee, T.J.C., Fromentin, J.-M., Hoegh-Guldberg, O., Bairlein, F„ 2002. Ecological responses to recent climate change. Nature 416, 389-395.
Wardle, D.A., Verhoeff, H.A., Clarholm, М., 1998. Trophic relationships in the soil microfood-wed: predicting the responses to a changing global environment. Global Change Biol. 4, 713—727.
Wolteis, V., Silver, W.L., Bignell, D.E., Coleman, D.C., Lavelle, P., van der Putten, W.H., de Ruiter, P.C., Rusek, J., Wall, D.H., Wardle, D.A., Brussaard, L„ Dangerfield, J.M., Brown, V.K., Giller, K.E., Hooper, D.U., Sala, O., Tiedje, J.M., van Veen, J.A., 2000. Effects of global changes on above- and belowground biodiversity in terrestrial ecosystems: implications for ecosystem functioning. BioScience 50, 1089-1098.