


Konstantin B. Gongalsky *, Fyodor A. Savin, Andrei D. Pokarzhevskii, Zhanna V. Filimonova A.N. Severtsov Institute of Ecology and Evolution. Russian Academy of Sciences, Leninsky prospect 33, Moscow, 119071. Russian Federation Available online 17 October 2005
Abstract
Soil macroinvertebrates were studied in a Mediterranean-type forest on brown-pebble forest soils in southern Russia. At the site, 144 intact soil cores (76 cm2 each) forming a grid of 24 x 6 units were taken in order to determine animal spatial distribution. Abundance of isopods was 166.3 ± 16.0 indiv. m 2 and they constituted about 12% of the total macrofaunal abundance. Biomass of isopods was 3.5 g nT2, or about 21 % of the total biomass of macrofauna. Three woodlice genera (Annadillidium, Cylisticus, and Trachelipus) were found at the site. The two latter genera formed almost all (93%) of the isopod population. We found that spatial distribution of woodlice was heterogeneous: areas with 4—5 individuals per sample were neighboring those without animals. In order to study soil factors influencing isopod distribution in the brown-pebble forest soil, the size of a sample was artificially increased by combining adjacent sample units. Litter mass (r= 0.41) and loss on ignition (LOl) (r = —0.55) significantly influenced isopod distribution. Soil pH was near neutral (6.79), LOl was 8.39, and the water holding capacity was 70.9%. Pebbles comprised up to 84% of the sample’s mass. Ca. 40 samples are recommended for estimation of isopod abundance in brown forest soil.
© 2005 Elsevier SAS. All rights reserved.
Keywords: Brown forest soil; Isopoda; Mediterranean forest; Sample size; Soil invertebrates; Woodlice
1.Introduction
Although data on diversity and abundance of woo¬dlice have been used for soil type diagnosis in southern regions of the USSR [7], terrestrial isopods have been poorly studied in Russia and species lists are only avail¬able for a few regions [23]. In Mediterranean-type eco¬systems, this species-rich group may be a good indica¬tor not only of soil type, but also of soil quality [15], resources of soil biota and geographical relations [20]. Estimations of diversity, abundance and biomass de¬pend largely on spatial distribution of animals, but iso¬pods are shown to be not-evenly distributed in the for¬est floor [13]. The distribution, in turn, reflects their relationships with other components of ecosystems. Hence, a spatial distribution study of animals is neces¬sary, from one hand, to establish a required volume and sample size for the valid estimation and, from the other hand, to sort out factors affecting the distribution.
Sampling of soil animals is carried out either ran¬domly or by using a systematic grid. In the latter case, the samples are taken in a certain distance from each other [4,19]. Although there are studies using the same methodology to unravel patchiness of isopod distribu¬tion within a biotope [12,13], there is no information about their distribution at the microscale of sampling point. We collected samples directly adjacent to each other so that they totally cover the studied area, there¬fore allowing for a robust count of animals [8].
Geostatistical methods, developed last years [4,9, 18], have helped to transform soil-zoological informattion into biogeographical ones by analyzing spatial dis¬tribution of animals in microhabitats and by extrapolating data into larger areas. However, in order for such methods to be applied, and accurate estimate of animal abundance needs to be obtained.
The aims of the present study were (i) to compare distribution of various soil properties, and isopods over a visually homogeneous plot; (ii) to maintain the mini¬mal number of samples needed for correct estimation of abundance and taxonomic diversity of isopods in the studied region.
2.Materials and methods
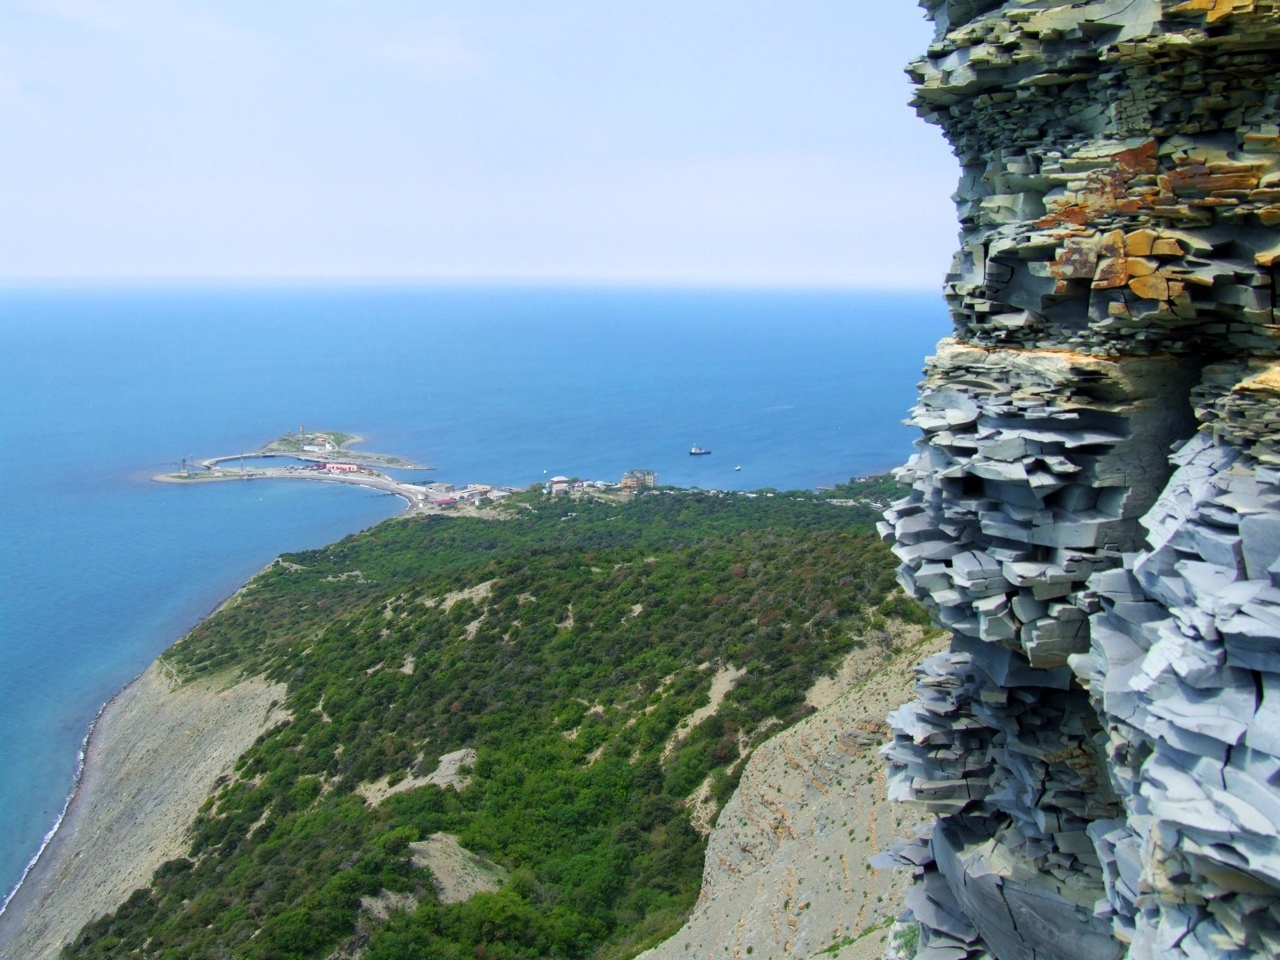
The study was carried out in the southern part of European Russia. The sampling plot was selected in an oak (Quercus pubescens)-beech (Carpinus orienta- lis) forest on brown-pebble forest soils near the village of Maly Utrish (the Black Sea Marine Station of Insti¬tute of Ecology and Evolution of RAS), 30 km from Novorossiysk (Krasnodar Region, 44°44' N, 37°26' E) at an altitude of 50 m above sea level (3 km from the Black Sea coast). The area surrounding the Station is difficult for tourists to access because of a lack of highways and is barely suitable for agriculture because of its pebbled soils and billowy landscape. It might be con¬sidered an untransformed Mediterranean landscape. Mean annual precipitation is 500 mm; mean July temperature is 20 °C. Soil organic matter content (loss on ignition, LOI) was 8.39% and water holding capacity (WHC) 70.9%, soil pH was near neutral (6.79). Crushed stones and pebbles comprised a substantial portion of soil up to 84% of the sample’s mass [8].
In June 1999, a pilot study was undertaken to estimate abundance and biomass of soil invertebrates. This comprised 25 randomly taken soil samples with a corer of 9.8 cm diameter (76 cm2) to a depth of 8-12 cm. One year later (June 15, 2000), 144 intact soil cores were collected to the same depth in the same biotope. The samples collected formed a grid of 24 * 6 units over an area of 216 x 56 cm in order to determine ani¬mal spatial distribution of naturally occurring woodlice. Samples were placed immediately into separate marked plastic bags and hand-sorted in the laboratory. Biomass was measured by direct weighing the live animals ob-tained by hand-sorting. Fresh litter, soil and pebble (fraction > 2.7 mm) mass, WHC, pH and LOI were measured in every soil sample using commonly applied methods. A detailed sampling procedure has been pub¬lished previously [8].
To consider the influence of sample size upon the results of isopod abundance estimation, we applied an artificial extension of sample size. Adjacent sample units in the grid were pooled to create a composite sample of increased size. Samples formed by combining 2 x 2, 3 x 3, 4 x 4, 5 x 5, and 6x6 units of individual samples were considered. Countable variables (e.g. number of animals, soil mass) were summed in order to obtain values for the large samples while for the measurable values (e.g. pH, LOI) means were calcu¬lated. Since some sample units were involved in a count more than once, a Bonferroni correction was applied in calculating significance level ip) [1].
Descriptive statistics, analysis of variance and Pearson r correlations were applied by using packages Stat- graphics Plus 3.0 for Windows (Statistical Graphics Corp.) and Statistica 6.0 for Windows [21]. Surfer 6.04 package (Golden Software) was used to analyze spatial distribution of isopods and soil parameters in the sampling location. Microsoft Excel was applied to model random sampling within the sampling location. Significance level for p in the study was 0.05.
3.Results and discussion
3.1.Soil parameters
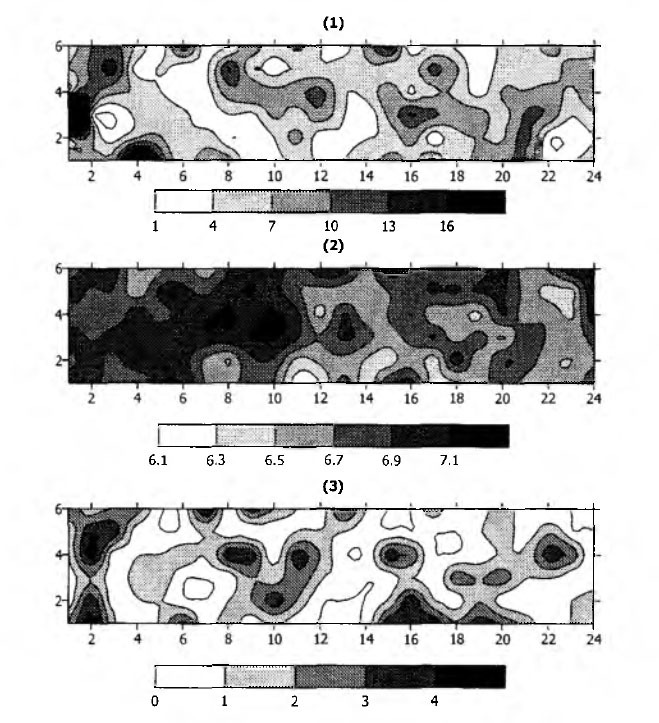
Litter distribution at the site was patchy (Fig. 1.1). Accumulation of litter was probably related to both the slow rate of oak leaves decomposition, and the micro¬relief and drainage features of the biotope. In some cases, litter mass accounted for 18% of the sample mass [8]. Other soil parameters, such as WHC and soil pH, were also rather heterogen eously distributed (Fig. 1.2).
3.2.General f eatures of macrofauna
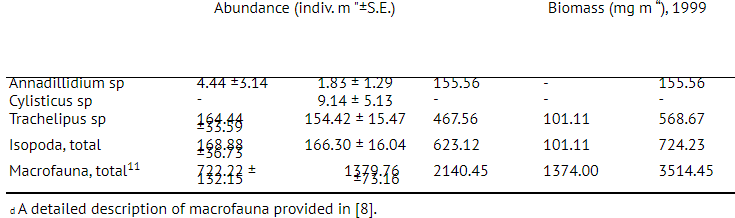
The total number of invertebrates caught at the plot was 1380 ± 73 ind. irf2 (Table 1). Isopoda, Pseudoscor- piones, Blattoptera and Raphidioptera larvae were re¬corded in this plot, which has not been however found in the other plots in European Russia [8]. The abun¬dance of Diplopoda in our plot was almost 10 times higher than that observed for the region earlier by Ghi- larov [7]. Most of the animals in our plot, especially diplopods, were small (< 5 mm). Ghilarov pointed out the low abundance of this type of animal. He estimated animal abundance by using 1 m2 sample units and in situ hand-sorted samples, a method known to lead to the underestimation of small animals [17].
3.3.Isopods at the studied plot
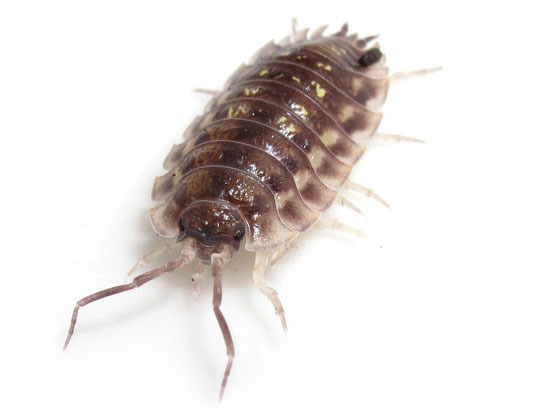
Woodlice were represented by three genera (Arma- dillidium, Cylisticus, Trachelipus). Two latter genera contained 93% of the isopod population. The abun¬dance of isopods during 2 sampling years (Table 1, 66.3-168.9 indiv. m 2) comprised 12-24% of the total macrofaunal abundance. Although there was no significant difference between the years (ANOVA, F < 0.001, P = 0.988), the seasonal changes in isopod abundance may be substantial [6,11]. For instance, in Italy, the higher numbers are usually observed in decidous forests in April compared to the other months [15]. We also found in Utrish, in winter 2000 a decrease in isopod abundance, down to 37.7 indiv. m 2 [Savin, personal observation.]. Hence, the abundance reported above is characteristic of summer only.
Besides these genera, the individuals of Armadilli- dium sp., Ligidium sp. were collected opportunistically in the surrounding forest. However, they were not found in the plot studied, since it covered a relatively small area of ca. 1.5 m2. Moreover, for similar habitats 70 km southeast from our plot along Black Sea coast (in the surroundings of a town of Gelendzhik), Ghilarov [7] pointed out the following species: Chaetophiloscia hastata, Protracheoniscus ghilarovi, Plathyarthrus sho- bli, Armadillidium vulgare, Trachelipus sp. and Ligidium sp. Their abundance for different habitats and different years (1955-1958) was in the range of 0.6-57 indiv. m 2, which is three times lower than in our study. However, Ghilarov collected samples in anthropogeni- cally disturbed habitats. The observations stress the need for further studies on isopods in the above-described area.
High biomass of isopods was an important trait of soil macrofauna at the plot. Although these animals usually do not play keyroles in most of soil ecosystems in Russia, in the Mediterranean forest, they accounted for 3.5 g m 2 fwt, or about 21% of the total macrofaunal biomass (Table 1), being second only to diplopods in biomass and seriously outweighing the third group, arionids. The high proportion of woodlice in soil animal biomass might be related to the negligible role of earthworms in the ecosystem during summer period.
3.4.Distribution of animals
The difference between minimal and maximal numbers of woodlice found over the plot was quite low: only five individuals per sample. Spatial distribution of woodlice was heterogeneous: areas with 4-5 individuals per sample were neighboring those without animals (Fig. 1.3). Some researchers have already mentioned that isopods are not distributed homogenously [3,5,10,16], and may even aggregate during day time [2]. This inherent heterogeneous distribution seriously influences the results of field estimation, but has not been considered in correction of estimation of isopod abundance. Here we try to elaborate recommendations for correct isopods sampling in the study region irrespective of spatial heterogeneity.
Table 1
Relative abundance (individuals m “ ± S.E.) in June, 1999 and 2000. and biomass (mg m 2) of woodlice in June, 1999 in Utrish (Southern Russia)
3.5.Correlation between soil factors and isopods
Soil factors considered did not significantly correlate with the distribution of animals in general and with woodlice particularly (Table 2.). ANOVA indicated that only litter mass was significantly influencing isopod distribution. This means that the core size used in the study (76 cm2) did not allow correlations between woodlice and soil pH, etc. to be demonstrated despite the fact that such correlations have already been found [7, 14].
Evidently, the correlation between soil parameters and animals’ distribution depends on sample size [18, 19,22]. The enlargement of sample size led to the increase of Pearson r correlation value (Table 3) between isopods and the most factors. Definite relationships started to appear only when patches of abiotic factors (areas of low pH values, bulks of litter) matched the size of the sample. It is obvious, that for various size groups (for example, small species of Trachelipus and large ones of Avmadillidium) an area of a conditional sample, at which these correlations became significant, would be different. It may be related to individual ranges of woodlice mobility. Interestingly, only the correlation between WHC and isopods was not dependant on the sample size (Table 3).
3.6.Minimal number of samples to collect isopods
Here we present recommendations for the number of samples needed to get significant results while estimating isopods’ abundance in southern Russia. As can be seen from Fig. 2.1, excluding one simulated case, the mean value of isopod abundance fitted into confidence intervals over total 144 samples already when 41 sample were pooled. The mean value did not significantly vary over the rest of hundred samples. However, to obtain the same results only 10 samples of 304 cm2 area (2x2 initial samples) were required (Fig. 2.2). Such samples are also convenient to estimate the influence of any of soil factors on woodlice.
4.Conclusions
Terrestrial isopods were distributed heterogeneously in brown forest soil and formed small aggregations that depended on soil factors such as litter mass, soil pH and LOI. However, these relations were revealed when sample size was more than 0.03 m2. Only 10 samples with in the investigated area were enough to estimate woodlice abundance in soil.
Acknowledgements
We are grateful to late Dr. N.A. Klyuev for analytical support and to Dr. A.S. Zaitsev (both at A.N. Severtsov Institute of Ecology and Evolution, Moscow) for valu¬able comments on the manuscript. Dr. K. Ekschmitt (Justus-Liebig University, Giessen, Germany) for statis¬tical advices and S. Ladanai (The Swedish University of Agricultural Sciences, Uppsala, Sweden) for the linguistic check. The work was partially supported by Russian Foundation for Basic Research (projects 03¬05-64127 and 04-05-74604).
Table 2
Analysis of variance ip) of some soil parameters influence on macrofauna and on isopods in the soil samples of 76 cm" area in 2000 in Utrish (southern Russia). Statistically significant values are in bold. LOI—loss on ignition, WHC—water-holding capacity
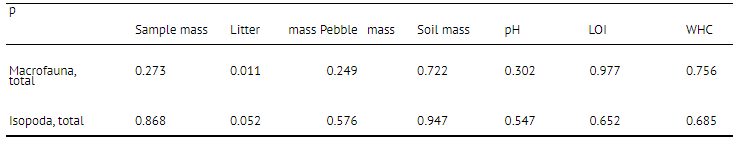
Table 3
Correlations (Pearson r value) between isopods and soil factors in the soil samples while artificially extending sample size in 2000 in Utrish (southern Russia). Statistically significant values are in bold. LOl—loss on ignition, WHC—water-holding capacity
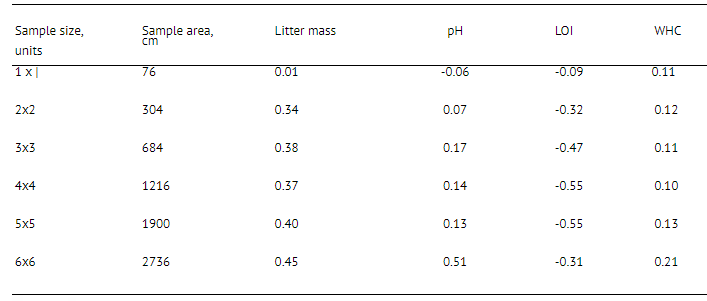
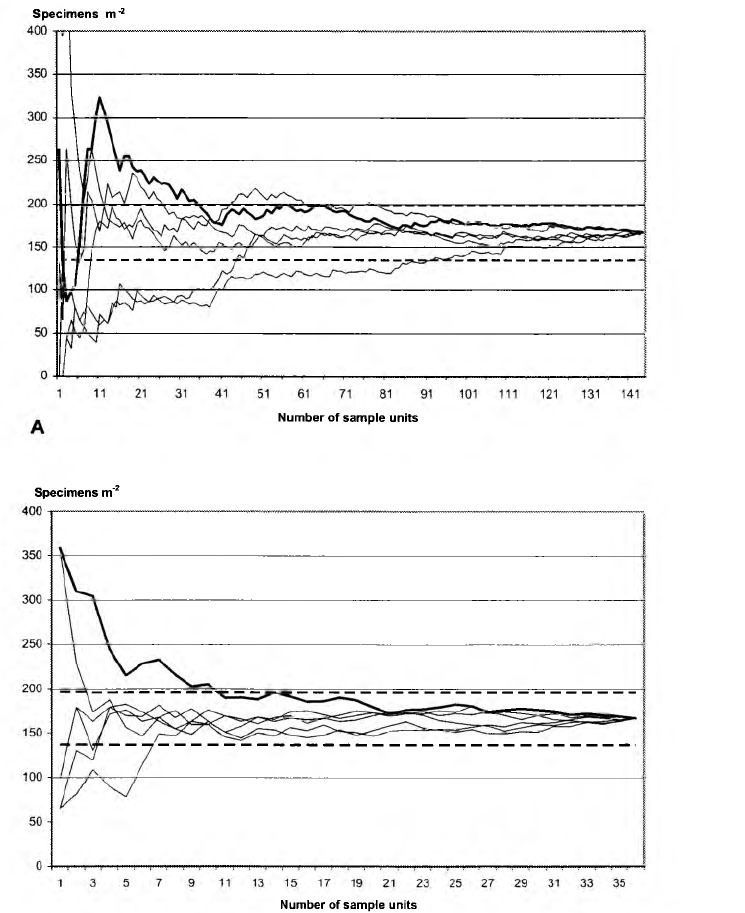
Fig. 2. Gradual change of mean value of isopod abundance while pooling (A) initial samples (7V= 144, sample area 76 cm",) and (B) artificially increased samples (N= 36, sample area 304 cm", 2x2 units of initial samples). The bold line is that corresponding to sequential pooling of samples from one to 144, fine lines are those corresponding to random pooling of samples using permuted sequence; dashed lines are those of 95% confidence intervals of mean value.
References
[1]R.J. Cabin. R.J. Mitchell, To Bonferroni or not to Bonferroni: when and how are the questions, ESA Bull. 81 (2000) 246-248.
[2]J.L. Cloudsley-Thompson, Studies in diurnal rhythms. II. Changes in the physiological responses of the woodlouse Onis- cus asellus to environmental stimuli. J. Exp. Biol. 29 (1952) 295-303.
[3]R.C. Davis. S.L. Sutton, Spatial distribution and niche separa¬tion of woodlice and millipedes in a dune grassland ecosystem, Ecol. Bull. 25 (1977) 45-55.
[4]C.H. Ettema, D.A. Wardle, Spatial soil ecology. Trends Ecol. I rolut. 17 (2002) 177-183.
[5]B. Frankel, Distribution of Trichoniscus pusillus Brandt (Crus¬tacea: Isopoda) on logs in Epping forest, Entomol. Mon, Mag. 115 (1980) 201-204.
[6]J. Frouz, A. Ali, J. Frouzova, R.J. Lobinske, Horizontal and vertical distribution of soil macroarthropods along a spatio-tem¬poral moisture gradient in subtropical Central Florida, Environ. Entomol. 33 (2004) 1282-1295.
[7]M.S. Ghilarov, Zoological methods in soil diagnostics, Nauka Publ., Moscow, 1965 278 pp. (in Russian).
[8]K.B. Gongalsky, A.D. Pokarzhevskii, Z.V. Filimonova, F. A. Savin, Stratification and dynamics of bait-lamina perforation in three forest soils along a North-South gradient in Russia, Appl. Soil Ecol. 25 (2004) 111-122.
[9]P. Goovaerts, Geostatistical tools for characterizing the spatial variability of microbiological and physico-chemical soil proper¬ties, Biol. Fertil. Soils 27 (1998) 315-334.
[10]M. Hassall, J.M. Tuck, D.W. Smith, J.J. Gilroy, R.K. Addison, Effects of spatial heterogeneity on feeding behavior of Porcellio scaber (Isopoda: Oniscidea), Eur. J. Soil Biol. 38 (2002) 53—57.
[11]E. Homung, M.R. Warburg, Seasonal changes in the distribu¬tion and abundance of isopod species in different habitats within the Mediterranean region of northern Israel, Acta Oecol. 16 (1995) 431—445.
[12]E. Homung, M.R. Warburg, Intra-habitat distribution of terres¬trial isopods, Eur. J. Soil Biol. 32 (1996) 179-185.
[13]M. Judas, H. Hauser, Patterns of isopod distribution: From small to large scale, Isr. J. Zool. 44 (1998) 333-343.
[14]K.L.T. Ong, The effect of soil moisture and pH on woodlouse populations, Entomol. Mon. Mag. 115 (1979) 137-139.
[15]M.G. Paoletti, M. Hassall, Woodlice (Isopoda: Oniscidea): their potential for assessing sustainability and use as bioindicators. Agric. Ecosyst. Environ. 74 (1999) 157-165.
[16]O.H. Paris, F.A. Pitelka. Population characteristics of the terres¬trial isopod Armadillidium vulgare in California grassland. Ecology 43 (1962) 229-248.
[17]A.D. Pokarzhevskii, J. Bohac, A.A. Gusev, Research of soil an¬imal populations at nature reserve territories and environmental problems, the case study in the Central Chernozem reserve, in: V.E. Sokolov (Ed.), Research of Animal Populations in Nature Reserves, Nauka, Moscow, 1988, pp. 251-263 (in Russian).
[18]J.-P. Rossi, P. Lavelle, J.E. Tondoh, Statistical tool for soil biol¬ogy. X. Geostatistical analysis, Eur. J. Soil Biol. 31 (1995) 173¬181.
[19]J.-P. Rossi, V. Nuutinen, The effect of unit size on the percep¬tion of the spatial pattern of earthworms (Lumbriciis terrestris L.) middens, Appl. Soil Ecol. 27 (2004) 189-196.
[20]S. Sfenthourakis, S. Giokas, E. Tzanatos, From sampling sta¬tions to archipelagos: investigating aspects of the assemblage of insular biota. Glob. Ecol. Biogeogr. 13 (2004) 23-35.
[21]StatSoft, Inc., 2001. STATISTICA, version 6. www.statsoft. com.
[22]A. Stein, C. Ettema, An overview of spatial sampling proce¬dures and experimental design of spatial studies for ecosystem comparisons, Agric. Ecosyst. Environ. 94 (2003) 31—47.
[23]N.T. Zalesskaya, L.B. Rybalov, Woodlice (Crustacea, Isopoda, Oniscoidea) of Moscow and Moscow region, in: M.S. Ghilarov (Ed.), Soil Invertebrates of Moscow Region, 1982, pp. 170-178 (In Russian).